

The Lost Decade
The Latest Open Doors Data Reveals a System Built on Fragility, not Strategy
Open Doors just reported 5% growth from 2023/24 to 2024/25.
But most people will focus on the Fall 2025 Snapshot showing a 1% decline in total (OPT + enrollment) for the current 2025/26 academic year (with a 17% drop in new enrollments, offset by a +14% in OPT).
And, while a 1% decline in the total number of international students may not seem so bad. The number of new international students coming to the US declined -7% last fall then continued to slide -17% this fall.
Let’s be precise about what actually happened:
New enrollment: -17% this year (following -7% last year)
Total enrollment: -6.5% in 2025 (compared to flat +0.4% in 2024)
OPT participation: +14% in 2025 (following +21% increase)
Overall: -1% in 2025 (compared to 5% growth in 2024)
But the problems have been a decade in the making.
As I told Dan Garisto at Nature:
“This is about our ability as a country to develop scientific capacity. The headwinds and the storm clouds are very, very dark at the moment.”
The Lost Decade
So, let’s avoid (please, for once) the annual obsession with year-over-year changes.
Even IIE seems to recognize the 2025 numbers are no cause for celebration:
The Open Doors press release notably omits any mention of “record numbers”, despite the 2024/25 data technically representing the highest number of international students ever recorded.
The “lost decade” doesn’t mean international students stopped coming. Japan’s “lost decade” had GDP growth too, but it was the wrong kind, masking structural decay while other nations built stronger foundations.
2025 marks a critical moment because it represents a decade-long transformation whose fragility has come into view:
Ten years that could have created a resilient talent strategy instead produced a system dependent on volatile elements: one country (India), one field (STEM), one degree level (graduate programs), one policy (OPT).
The National Academies report, “International Talent Programs in the Changing Global Environment” states it directly:
“The United States does not have a whole-of-government STEM strategy or coordination of existing talent recruitment efforts across federal agencies.”

Other nations have built something different. They’ve “developed and implemented programs to recruit and retain talented individuals from abroad” with “predictable pathways to permanent residency or citizenship”, while the US immigration system has become “outmoded and rigid”.
The result: maximum uncertainty for students (OPT to H-1B lottery to decade-long green card backlogs) and maximum vulnerability for institutions (dependence on volatile enrollment streams). A system optimized for neither talent development nor political sustainability: just institutional revenue and temporary labor supply.
The signs were there. But as Melissa A. Whatley and I argued in “Open Doors, Closed Eyes,” year-to-year fixation on headline numbers obscures decade-long transformations and prevents the strategic thinking we desperately need.
Here are the realities visible in the just-released Open Doors and Fall Snapshot data:
Enrollment Has Been Flat for 10 Years
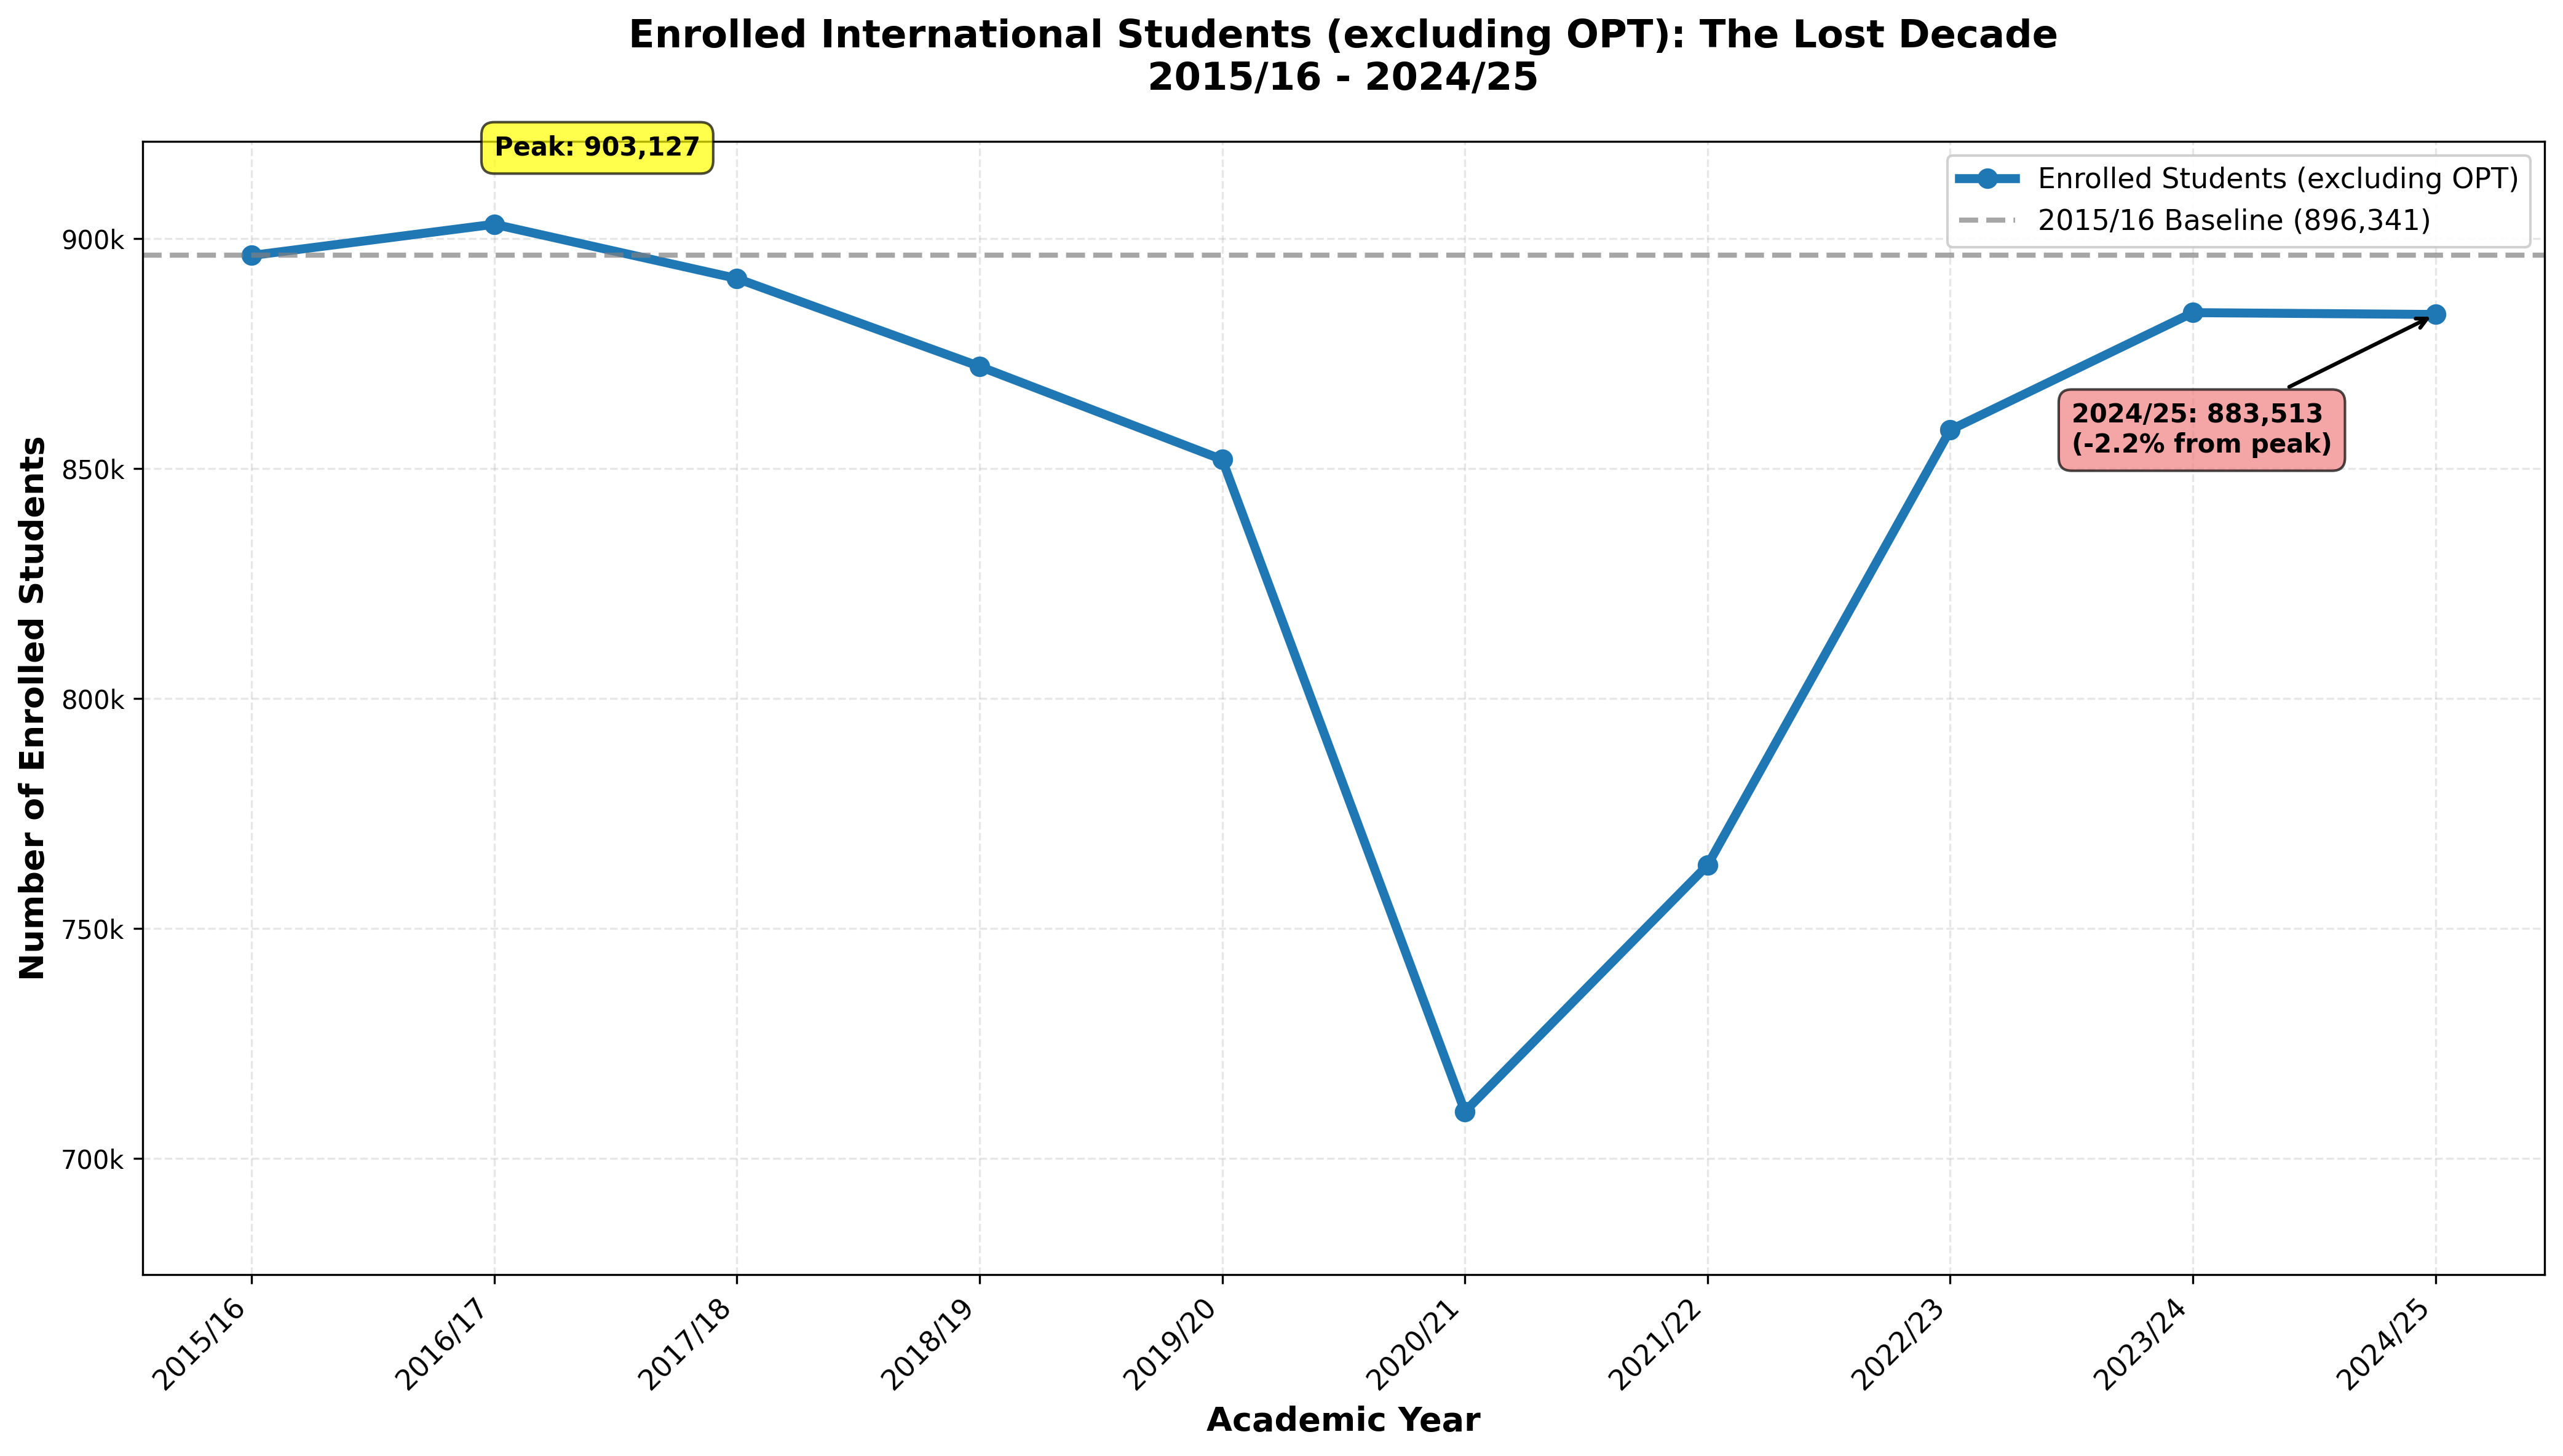
The U.S. enrolled fewer degree-seeking students in 2024/25 (883,513) than in 2015/16 (896,341). Strip out OPT, and enrollment has been stagnant for a decade.
When reporters ask if the new Fall 2025 Snapshot (-1%) signals stagnation, I remind them: enrollment has been stagnant for 10 years.
The U.S. Shifted From Diverse Fields to a STEM Pipeline
One of the most overlooked transformations: the concentration toward STEM fields, which now account for over 50% of all international students, driven by tech sector demand and policy incentives.
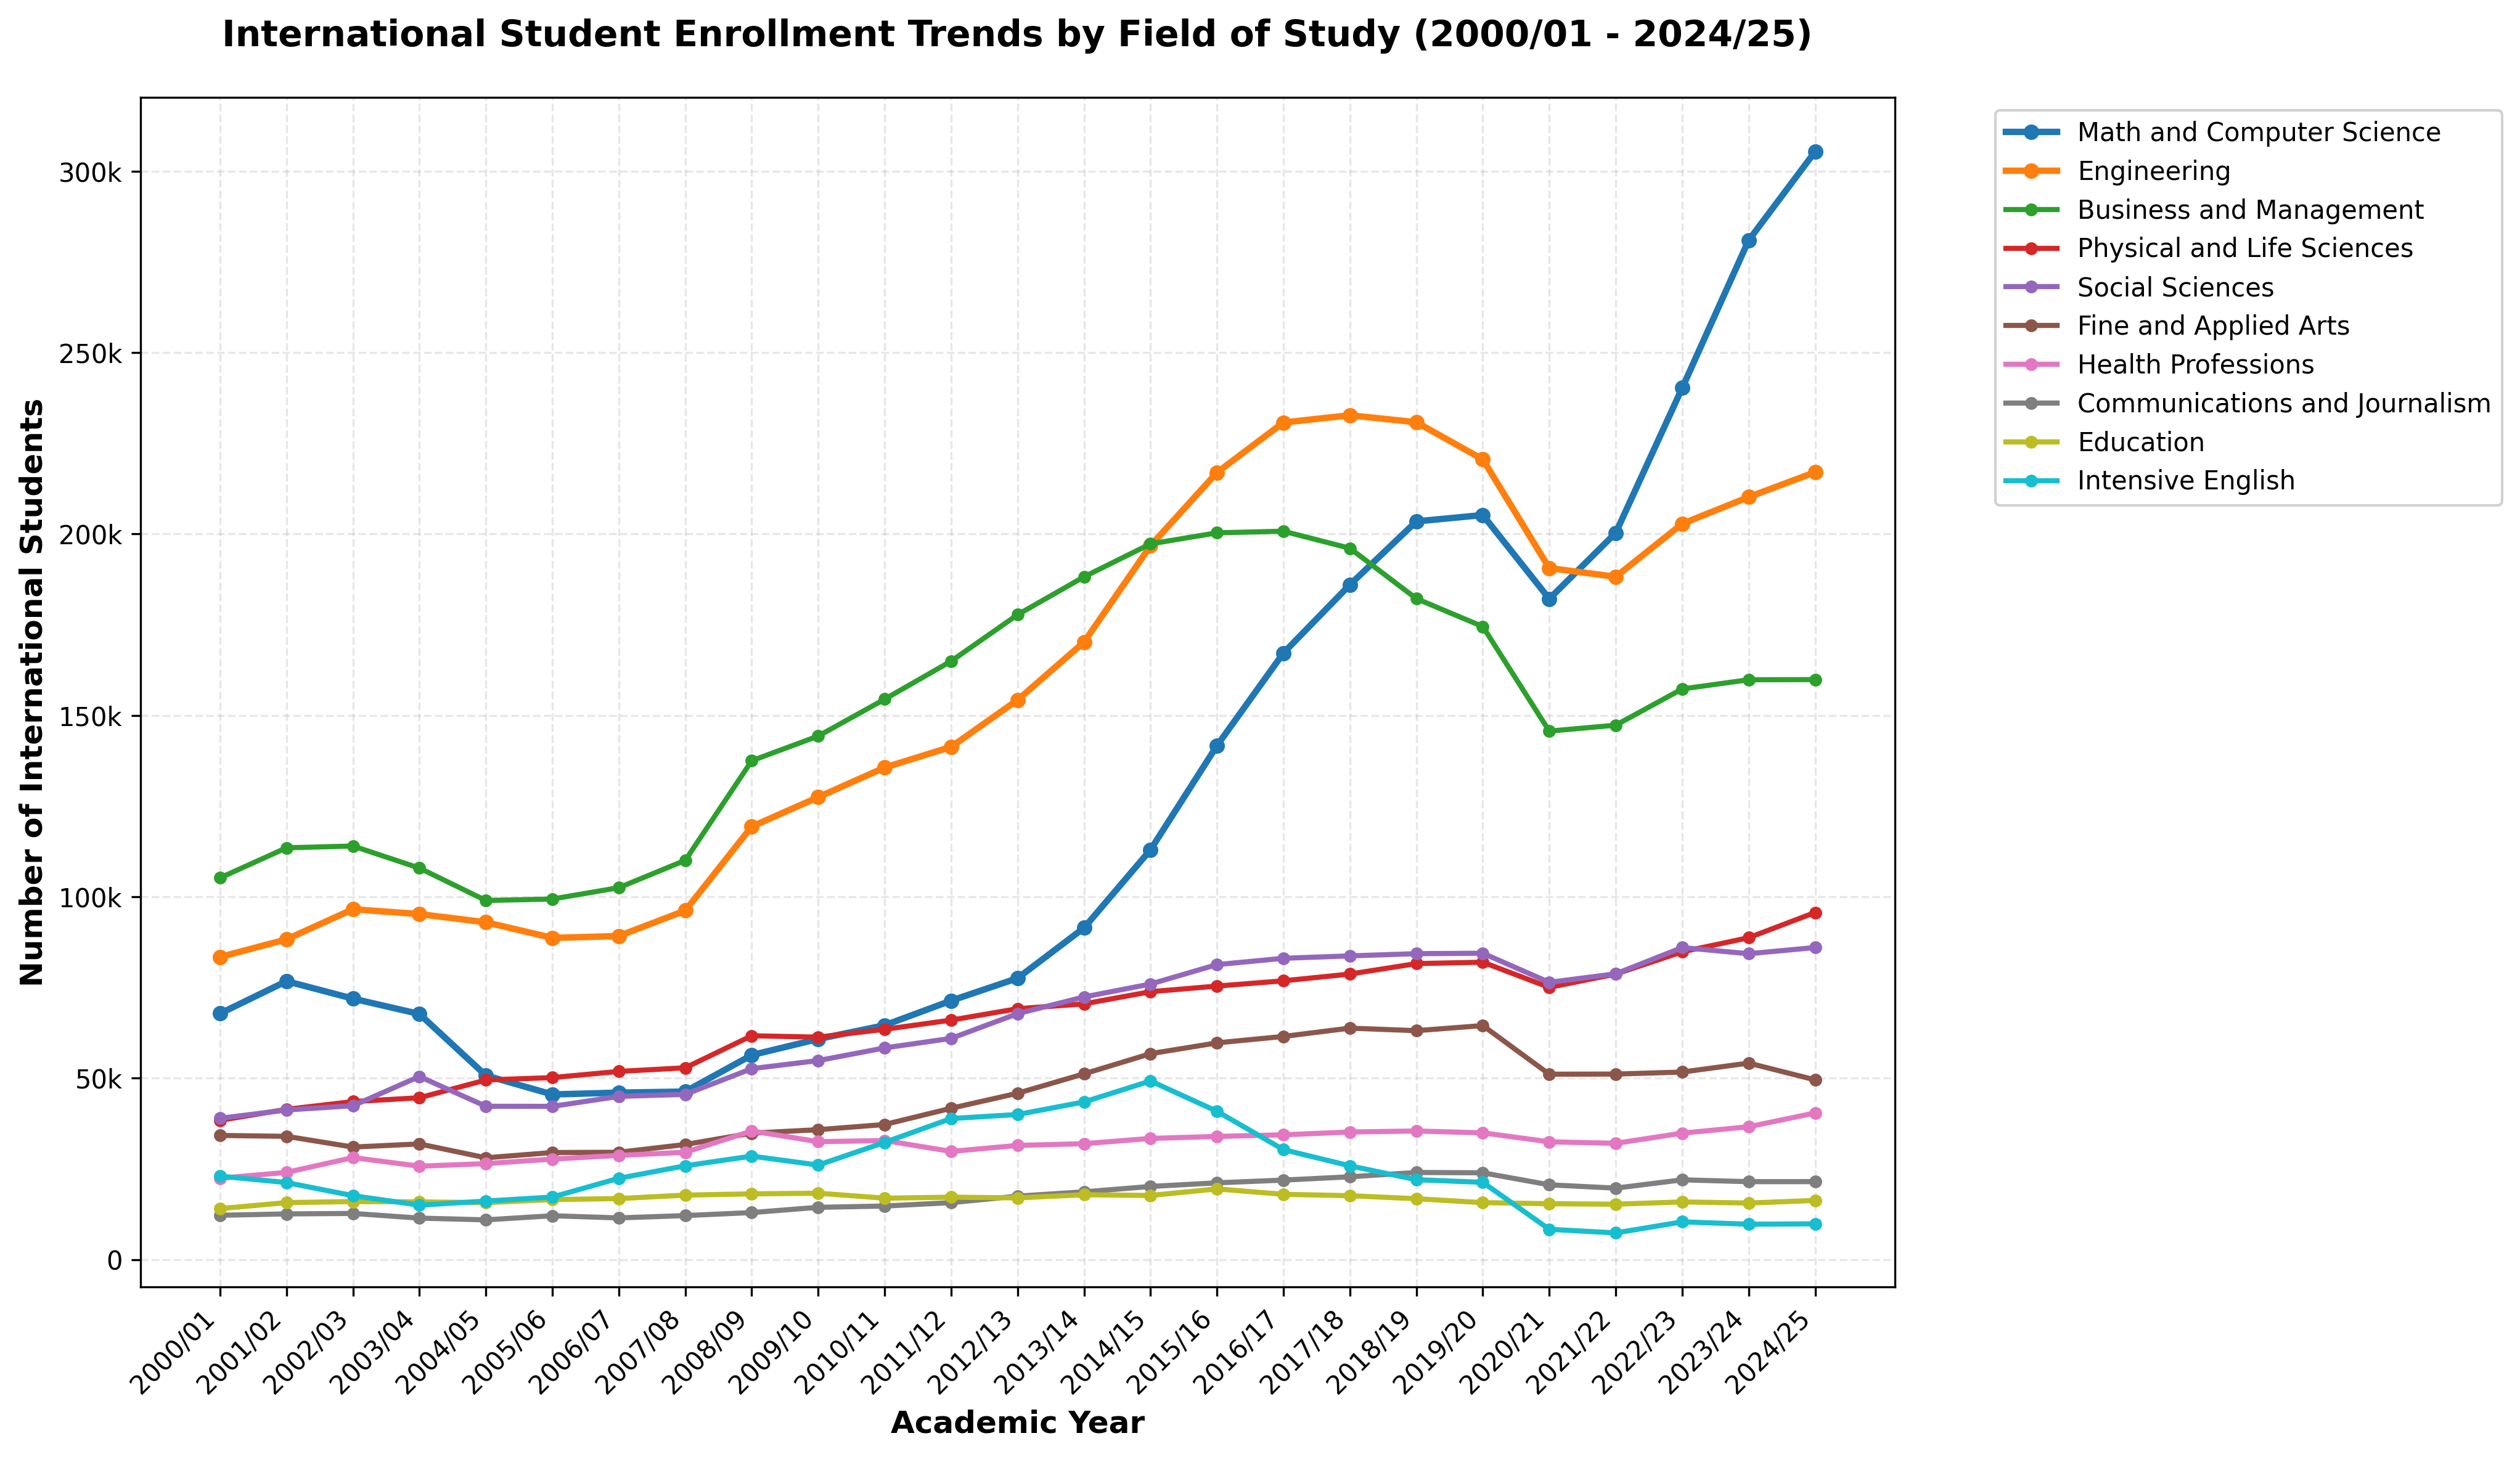
Today, U.S. international education operates as a STEM graduate training and work-authorization platform for the tech sector.
Look at the shifts post-Great Recession. The system consolidated into STEM dominance where Math and Computer Science alone (305,377 students) now enrolls more international students than the bottom nine fields combined.
Math/CS more than doubled over the last 10 years, surging from 141,651 to 305,377 students, and the 2023/24 Open Doors release celebrated that “more than half (56%) of international students across academic levels pursued STEM fields of study.”
Don’t misunderstand. STEM fields represent genuine educational value for students and the United States. They develop critical thinking, problem-solving skills, scientific literacy, and prepare students for high-demand careers.
But here’s the tension:
The populist right points to a troubling pattern. Over 500,000 tech jobs eliminated since 2022 at companies including Microsoft, Google, Meta, Amazon, Intel, Tesla, and Cisco, while OPT enrollment grew massively. Critics of OPT point to potential displacement; defenders cite the “brain freeze” and damage OPT termination would cause to the US economy. The disagreement reflects competing assessments of whose anxieties matter and how labor markets actually function.
So, while the increasingly concentration in STEM fields may be a sign of success for many, it’s also fair to point out recent trends mark a departure from the historic pattern of international education that enrolled students across the full spectrum of human knowledge.
OPT Shifted from an Optional Supplement to Structural Pillar
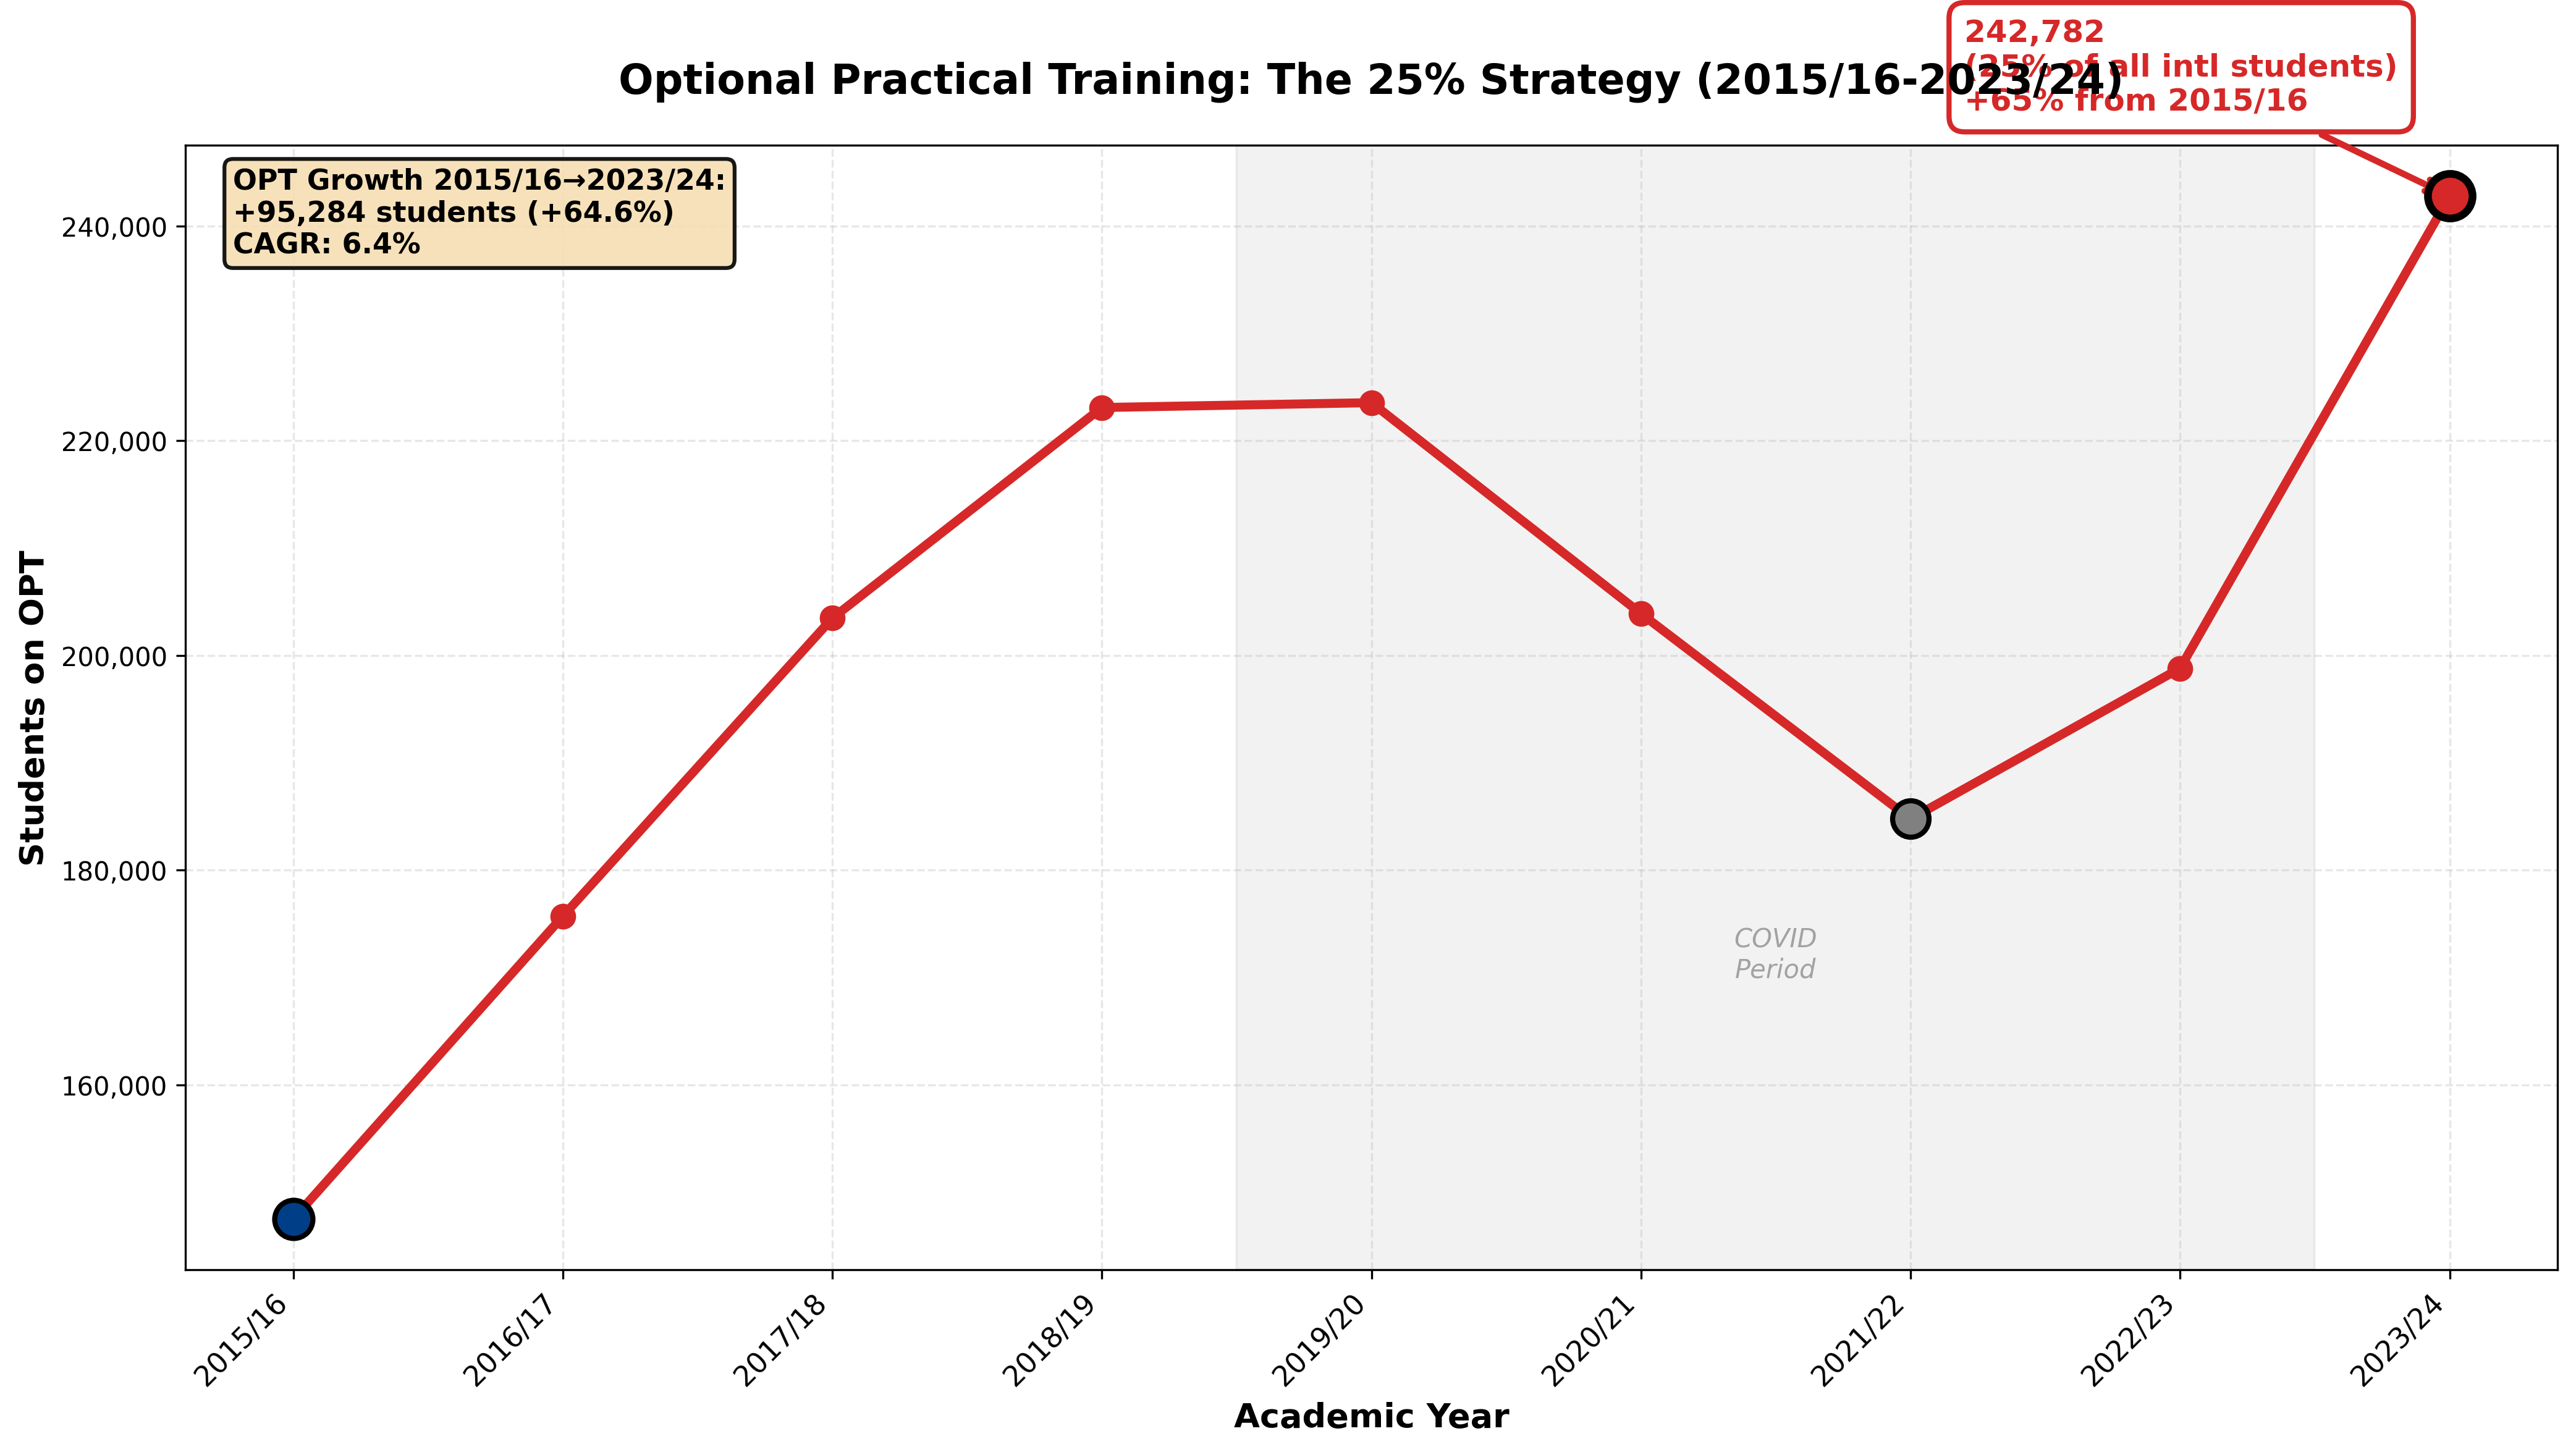
Optional Practical Training (OPT) students now comprise 25% of the 1.2 million total international students: up from 16% ten years ago. STEM OPT alone surged 34.3% in one year from 2023/24 to 2024/25.
OPT has doubled in 10 years. 1 in 4 “international students” are not enrolled in a university. Growth in OPT has masked real enrollment declines for the last decade.
OPT is no longer a supplementary benefit. It is the load-bearing beam of the entire U.S. model. It appears to be ripe for regulatory reform… and soon. (Be sure to check out the OPT Observatory if you want to see data on your institution and state.)
In this year’s Fall Snapshot report, 92% of U.S. institutions report that without OPT, international students would likely choose other countries for their education. The recent IFP/NAFSA survey makes the risk concrete: 54% of current international graduate students say they wouldn’t have enrolled without OPT.
The Fall Snapshot shows OPT numbers continue rising (+14%), but this won’t last. Two consecutive years of graduate enrollment declines (2024/25: -3% and 2025/26: -12%) plus looming changes to OPT mean growth will likely slow or reverse.
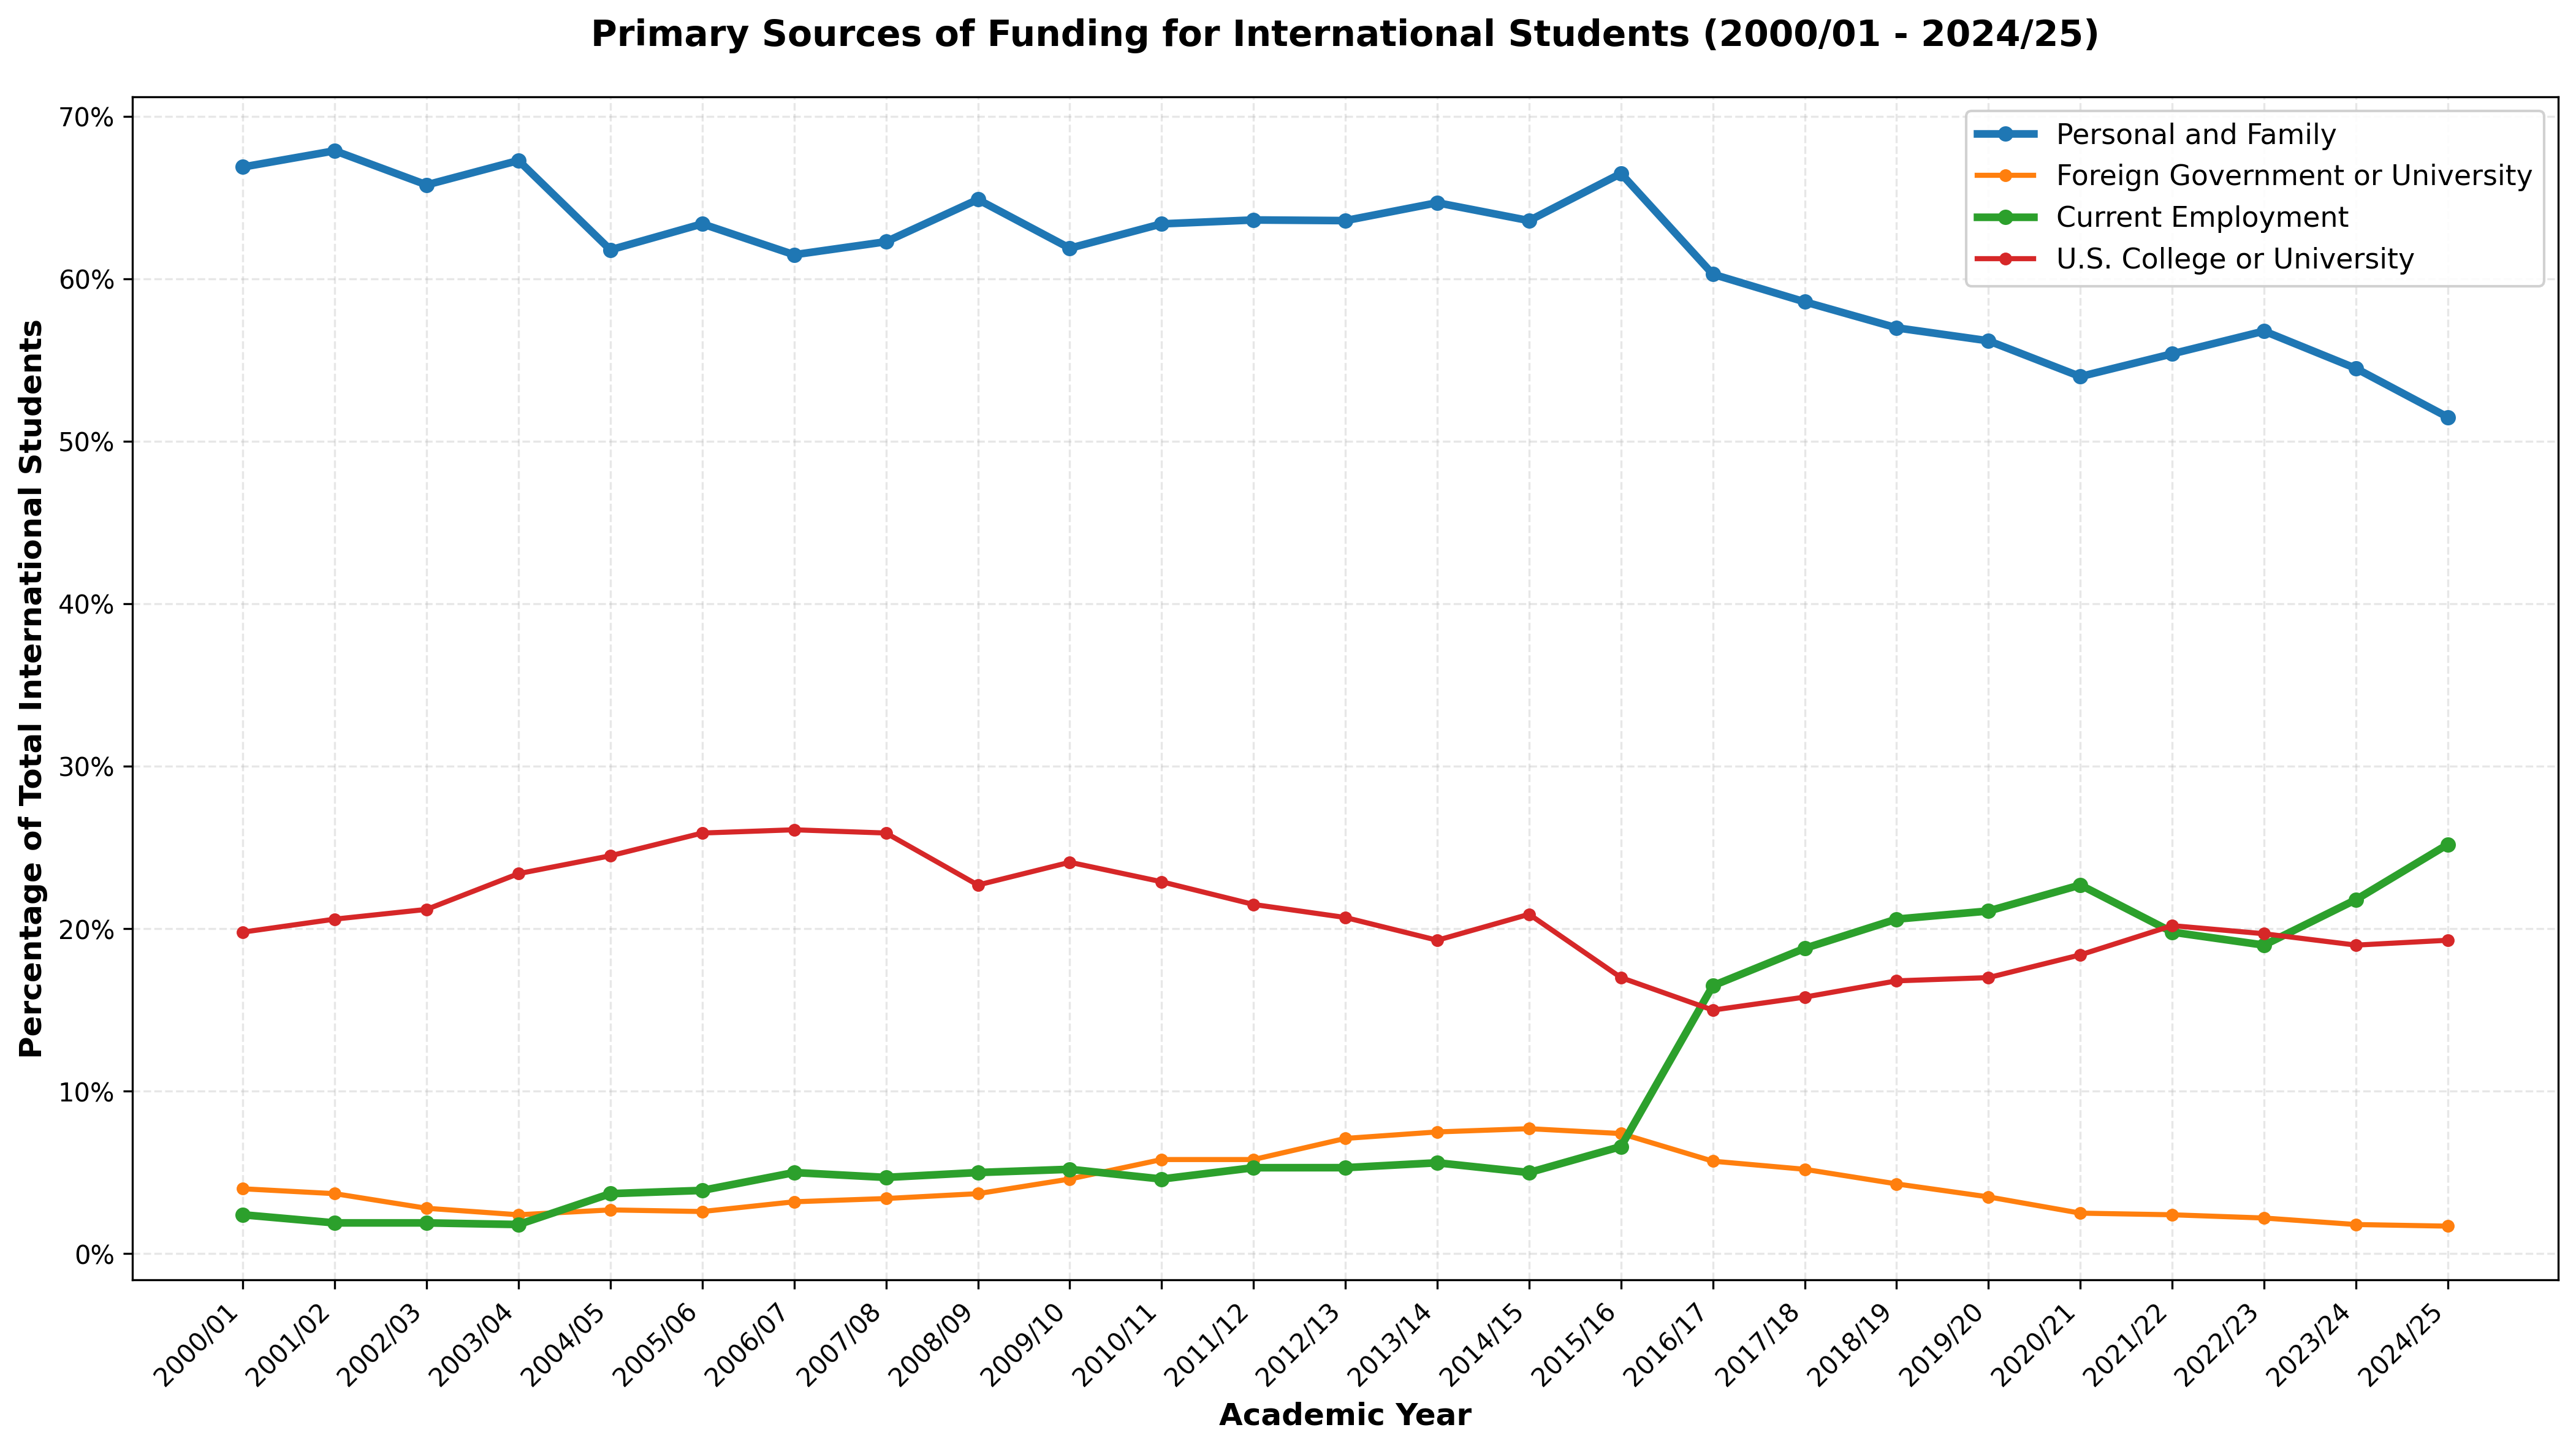
Look at the green line above.
Current employment has surged with a 10x increase over the last 10 years: the single most consequential shift in international student financing.
This category, which includes OPT work authorization, represented 2% in 2000/01, then began accelerating around 2015/16, growing explosively from 7% to over 25% by 2024/25. It’s now the second-largest funding source, nearly matching Personal and Family funding.
The Rise (and Fall) of Undergraduates from China was Unsustainable
The Great Recession forged the full-pay Chinese undergraduate model (2008-2015). When state appropriations for public universities plummeted between 2008-2013, institutions discovered international students as the solution to structural budget deficits.
Chinese undergraduates became the archetypal “ideal” international student from an institutional revenue perspective: they paid full out-of-state tuition, required minimal financial aid, came from families wealthy enough to afford four years of expenses upfront, and enrolled in large cohorts that offset declining domestic enrollment.
Between 2009/10 and 2015/16, Chinese undergraduate enrollment exploded.
Then the market peaked in 2016/17 and entered terminal decline.
Enrollment from China is down over 15% from 2015/16 (328,547) and over 25% from its 2019/20 pre-pandemic peak (372,532) to 2024/25 (277,398).
Moreover, Sarah McLaughlin has documented how this financial dependency on Chinese tuition revenue created institutional vulnerability to authoritarian influence, as universities became reluctant to defend academic freedom or protect dissident voices when doing so might jeopardize lucrative enrollment pipelines.
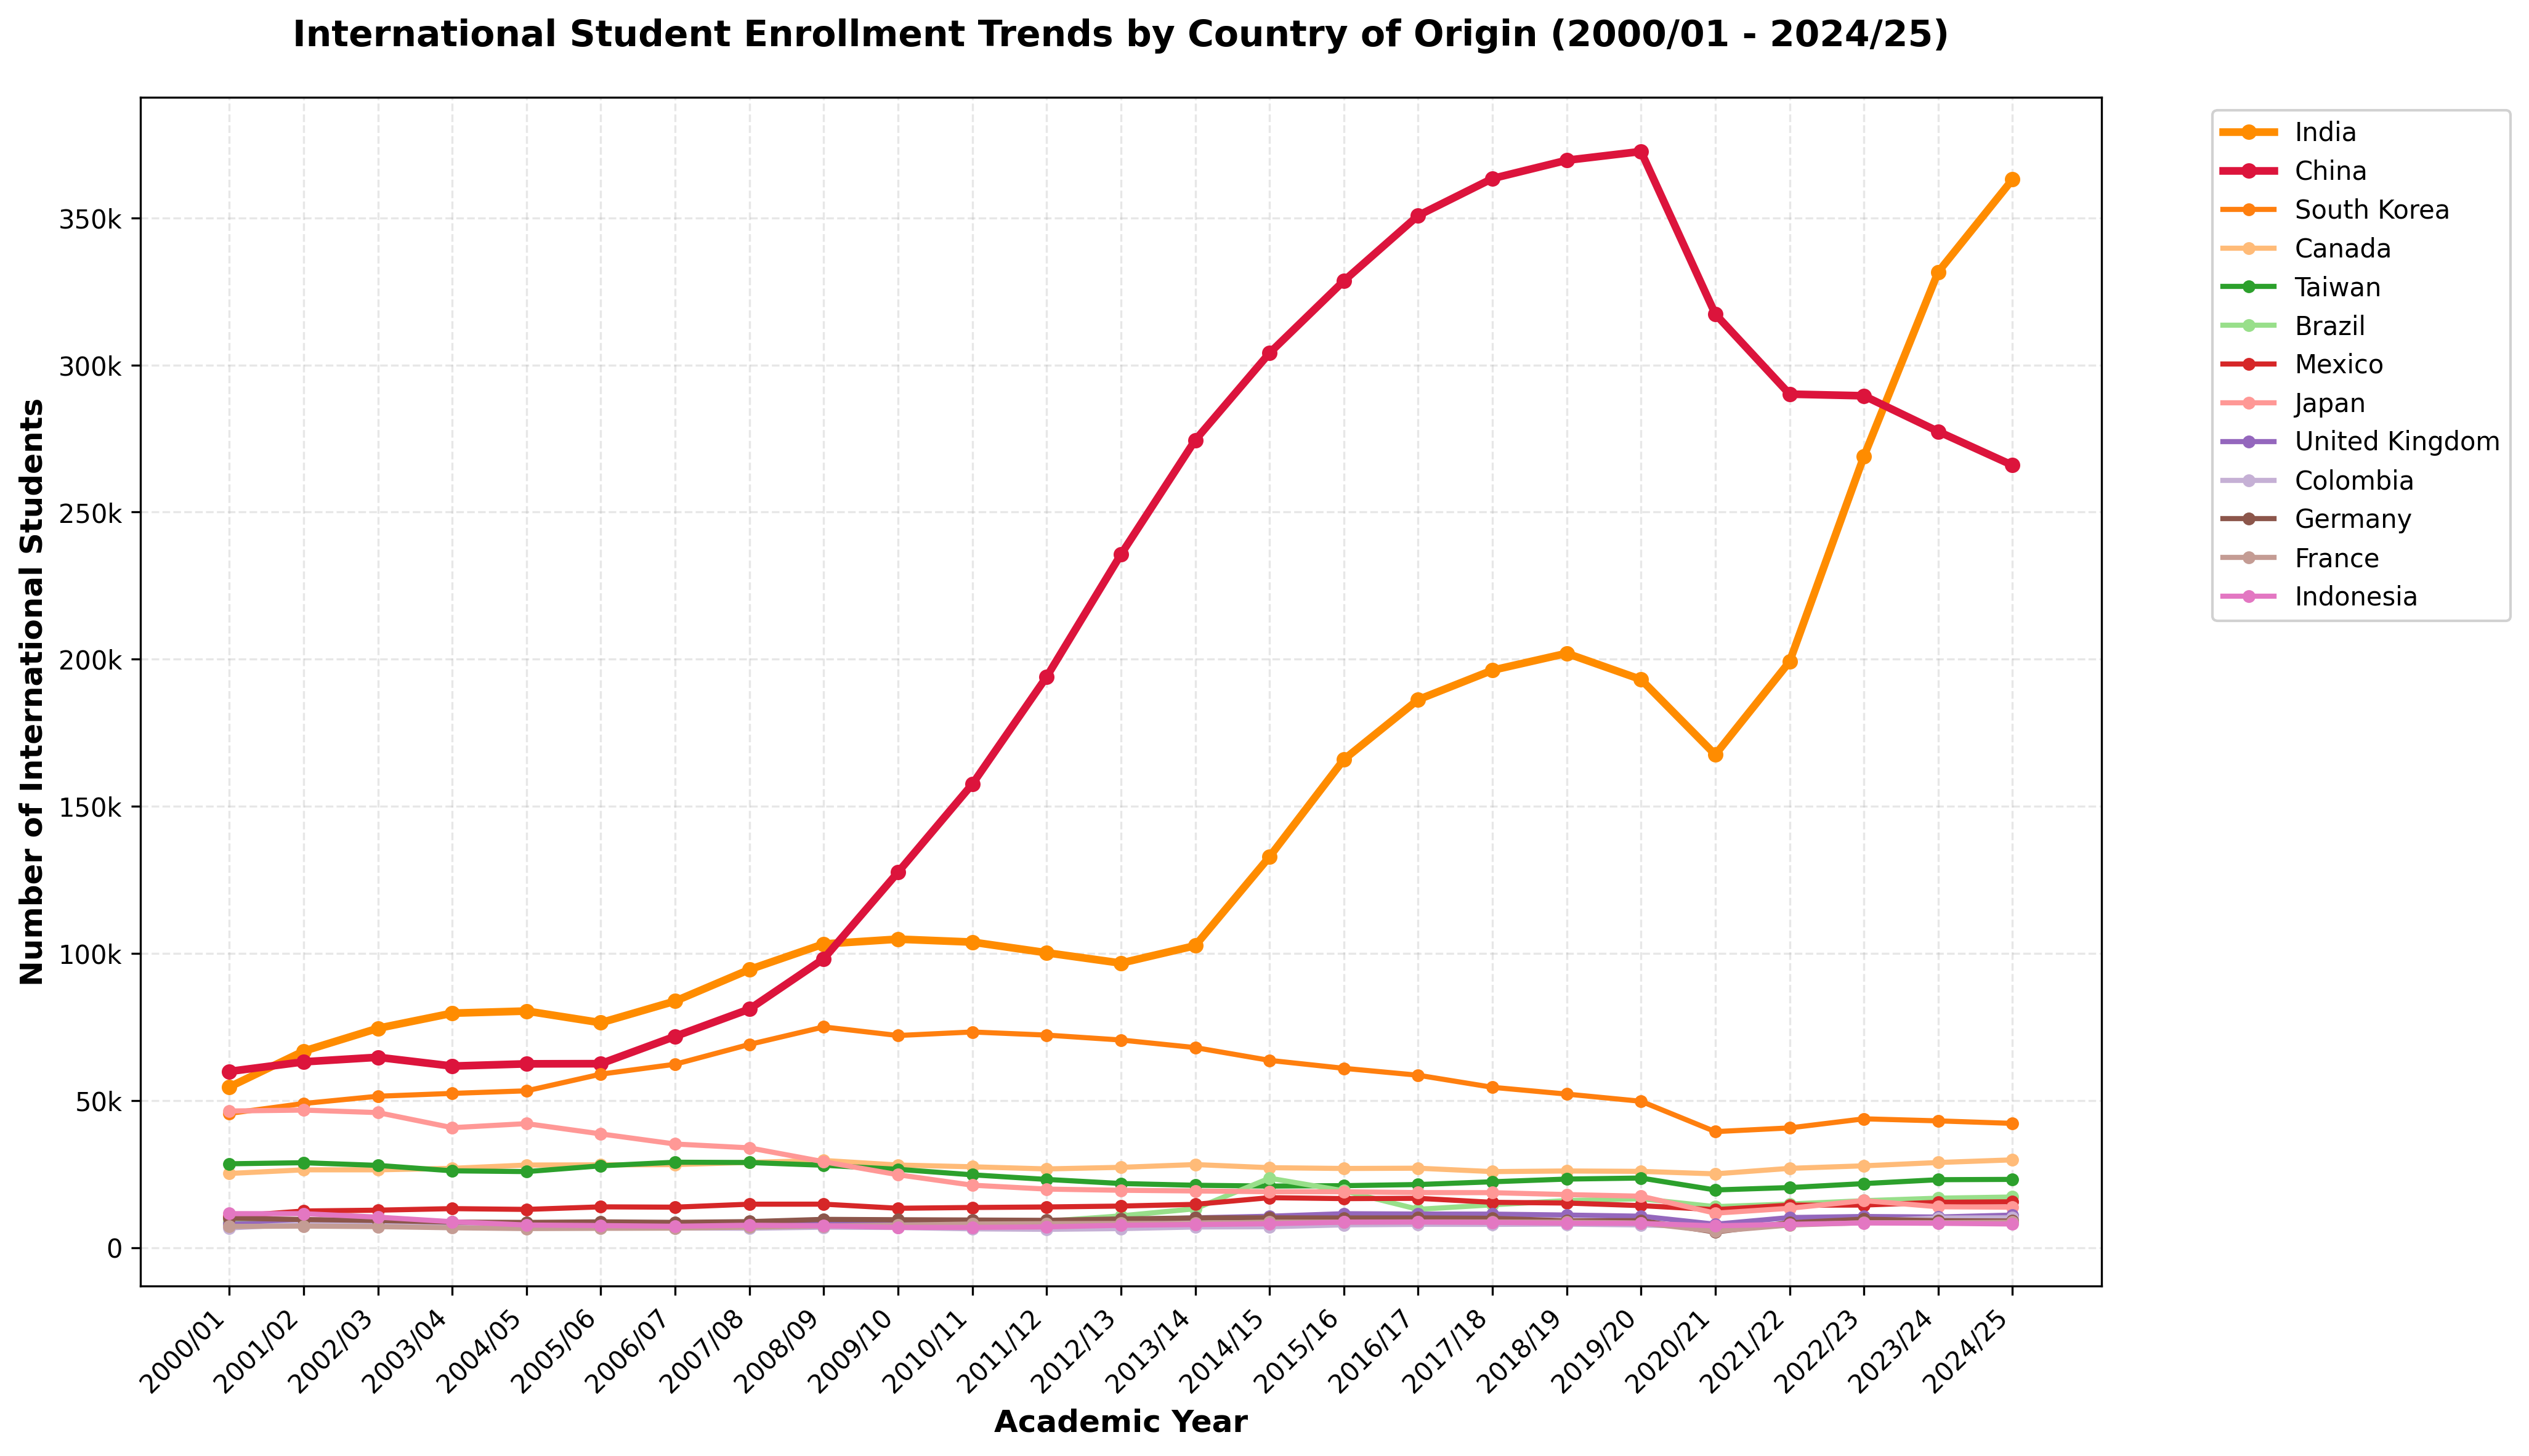
India’s Master’s STEM OPT Surge is Likely Short-Lived
While China declined, India more than doubled—increasing from 165,918 to 363,019 (+120%)—with the surge concentrated in graduate STEM and OPT pathways.
The post-COVID pandemic recovery was graduate-only, STEM-only, and India-only.
India accounts for approximately 70–75% of all H-1B visa recipients in the latest available government data (FY 2024–2025), representing by far the largest national group among H-1B holders in the U.S.
India comprises 40% of all students on OPT and saw a staggering one-year OPT surge of 47% from 2023/24 (97,556) to 2024/25 (143,740).
As I’ve highlighted: OPT reform is likely coming.
The Great De-Diversification of Cultural Exchange Warrants More Attention
Years of celebrating growth and highlighting $55 billion in economic impact minimized the market concentration in two countries (India and China) that has now exposed U.S. universities to significant risk.
Even you don’t believe the economic argument may be losing steam, it is important to recognize the countries international students come from has become less and less diverse over the past 25 years.
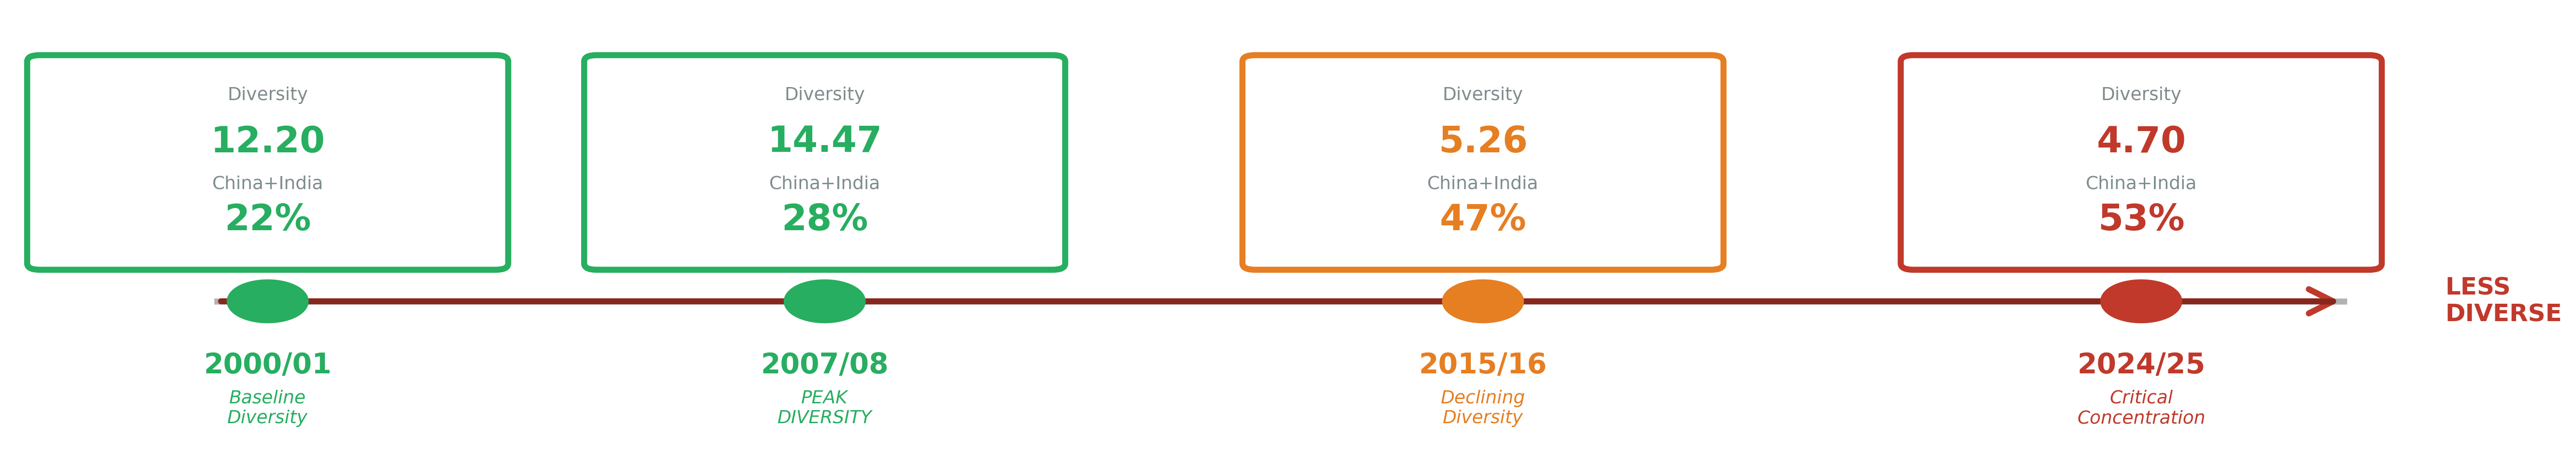
In 2007/08 before the Great Recession, the Effective Number of Groups (a formula to determine compositional diversity) showed high compositional diversity (14.47), with about 14 equally-sized groups present among the top 25 countries. China and India represented just over one-quarter (28%) of the population.
In 2000/01 (12.20), China and India represented only 11% and 10% of all international students respectively.
Then came the Great Recession, ad hoc responses to immediate fiscal pressures, and the system began concentrating.
By 2015/16, compositional diversity decreased to 5.26, with China and India representing 47% of the population.
In today’s latest Open Doors 2024/25, compositional diversity further declined to 4.70. China and India now represent 53% of the total population.
A recent Pew Research survey found that while most Americans (79%) think it’s good for U.S. colleges and universities to accept international students, widespread support also exists for limiting enrollment from China and India: the two countries that now dominate international student populations.
Graduate Enrollment Has Become the System’s Single Point of Failure
Undergraduate enrollment collapsed by 15% over the decade, from 349,016 (2015/16) to 300,944 (2024/25).
This wasn’t a COVID phenomenon. Undergraduate enrollment peaked in 2015/16, declined every year through 2019/20 (pre-pandemic), dropped further during COVID to 261,961 (2020/21), and has never recovered to pre-2017 levels, despite years of “record growth” headlines and single-digit growth in this year’s Open Doors report.
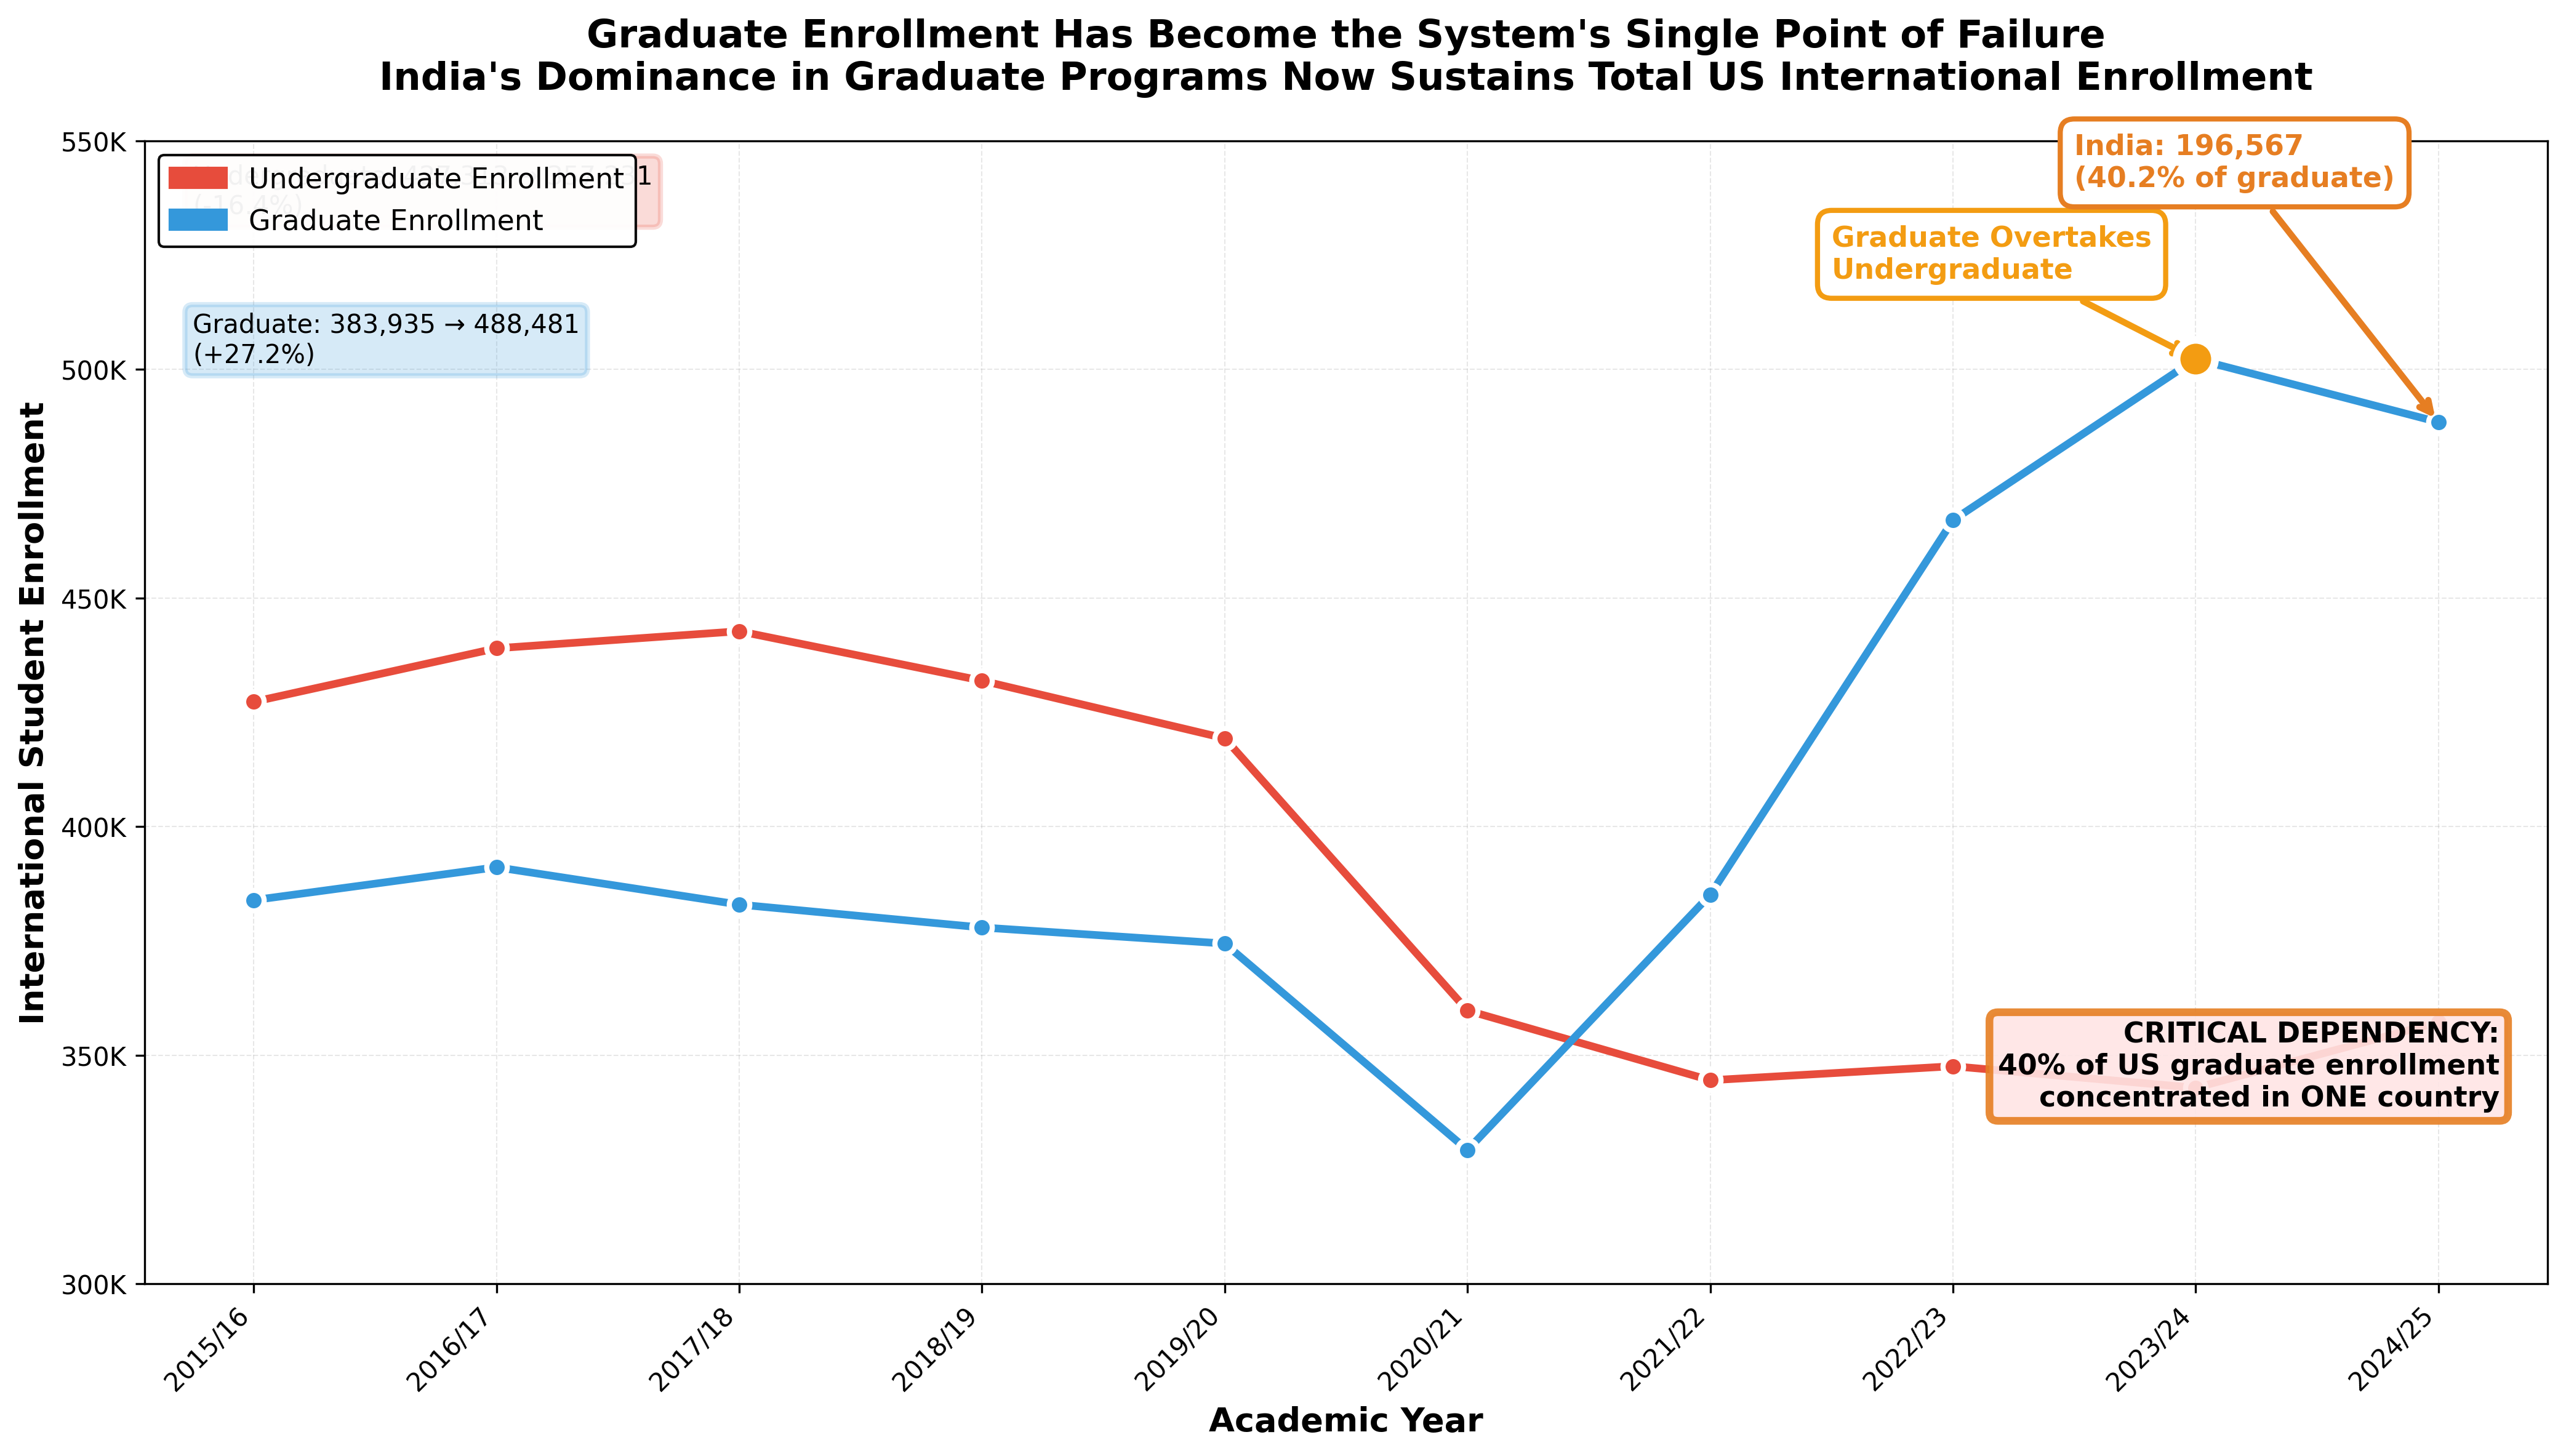
Lucrative graduate programs kept the system from overall decline.
Master’s programs grew 31% over the decade, from 233,463 (2015/16) to 306,123 (2024/25). Doctoral programs, which tend to cost institutions money, increased 25%, from 122,655 to 153,418.
Without this graduate surge, primarily from India, total enrollment would have declined significantly over the last decade.
The Fall 2025 data confirms a -12% decline and signals the risk of sustained graduate enrollment contraction in what has been holding up the sector.
Community Colleges Aren’t an International Education Success Story
IIE’s press release highlights that “community colleges experienced the fastest rate of growth (+8%) among institutions,” but this framing lacks context and obscures the sector’s decade-long enrollment decline.
Community colleges and associate’s colleges still enroll 28% fewer international students than they did a decade ago, despite the recent uptick.
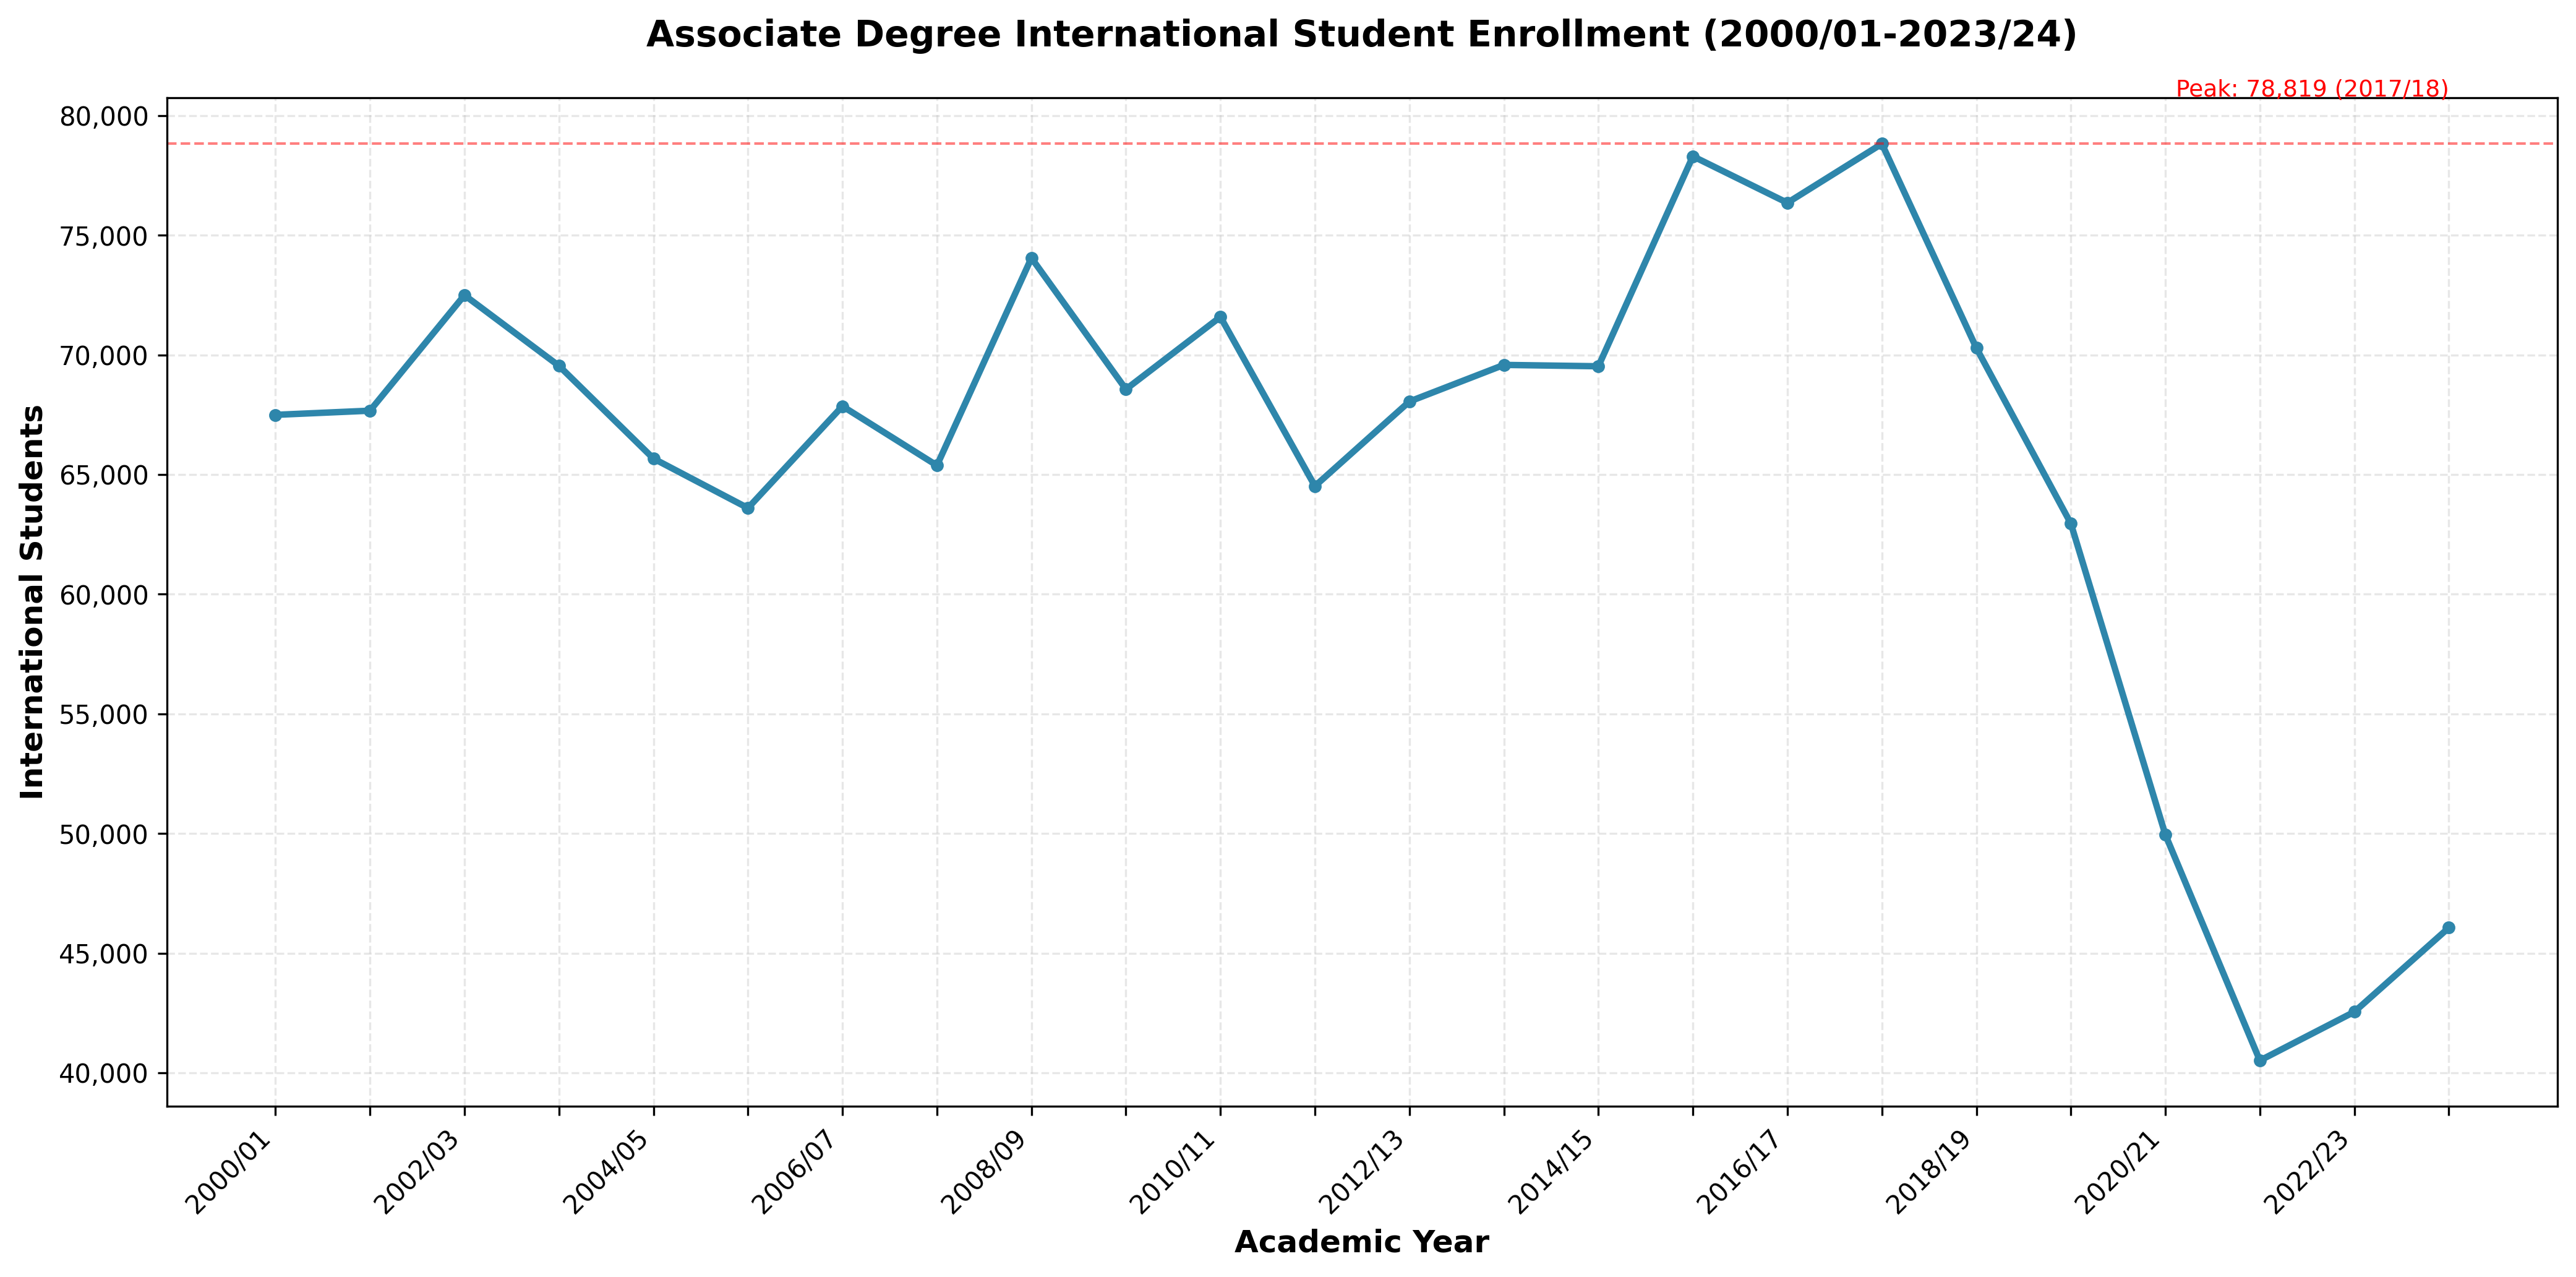
Community college international enrollment collapsed throughout 2017-2024, with the 2017-2020 period showing consistent double-digit declines that accelerated during COVID when community colleges lacked the resources and prestige to maintain international programs.
More critically, the composition shift signals economic stratification, not democratization.
Based on SEVIS data, India enrolls just 0.7% in Associate programs and China sends 1.3% to community colleges. Compare that to Nepal (21%) and Vietnam (17%). African nations dominate community college enrollment, with 22 countries maintaining >15% concentration in Associate programs, seeking a low-cost entry point to U.S. higher education.
The data also highlights the affordability crisis: SEVIS data shows students migrating to states like Texas with affordable public university systems, tech employment, and lower-cost alternatives to coastal privates.
The U.S. Now Ranks Third After Australia and UK
The U.S. has fallen to third choice among prospective international students, trailing Australia (28%) and the UK (22%), with only 19% selecting it as their first preference: a 3-percentage-point decline from earlier in 2025.
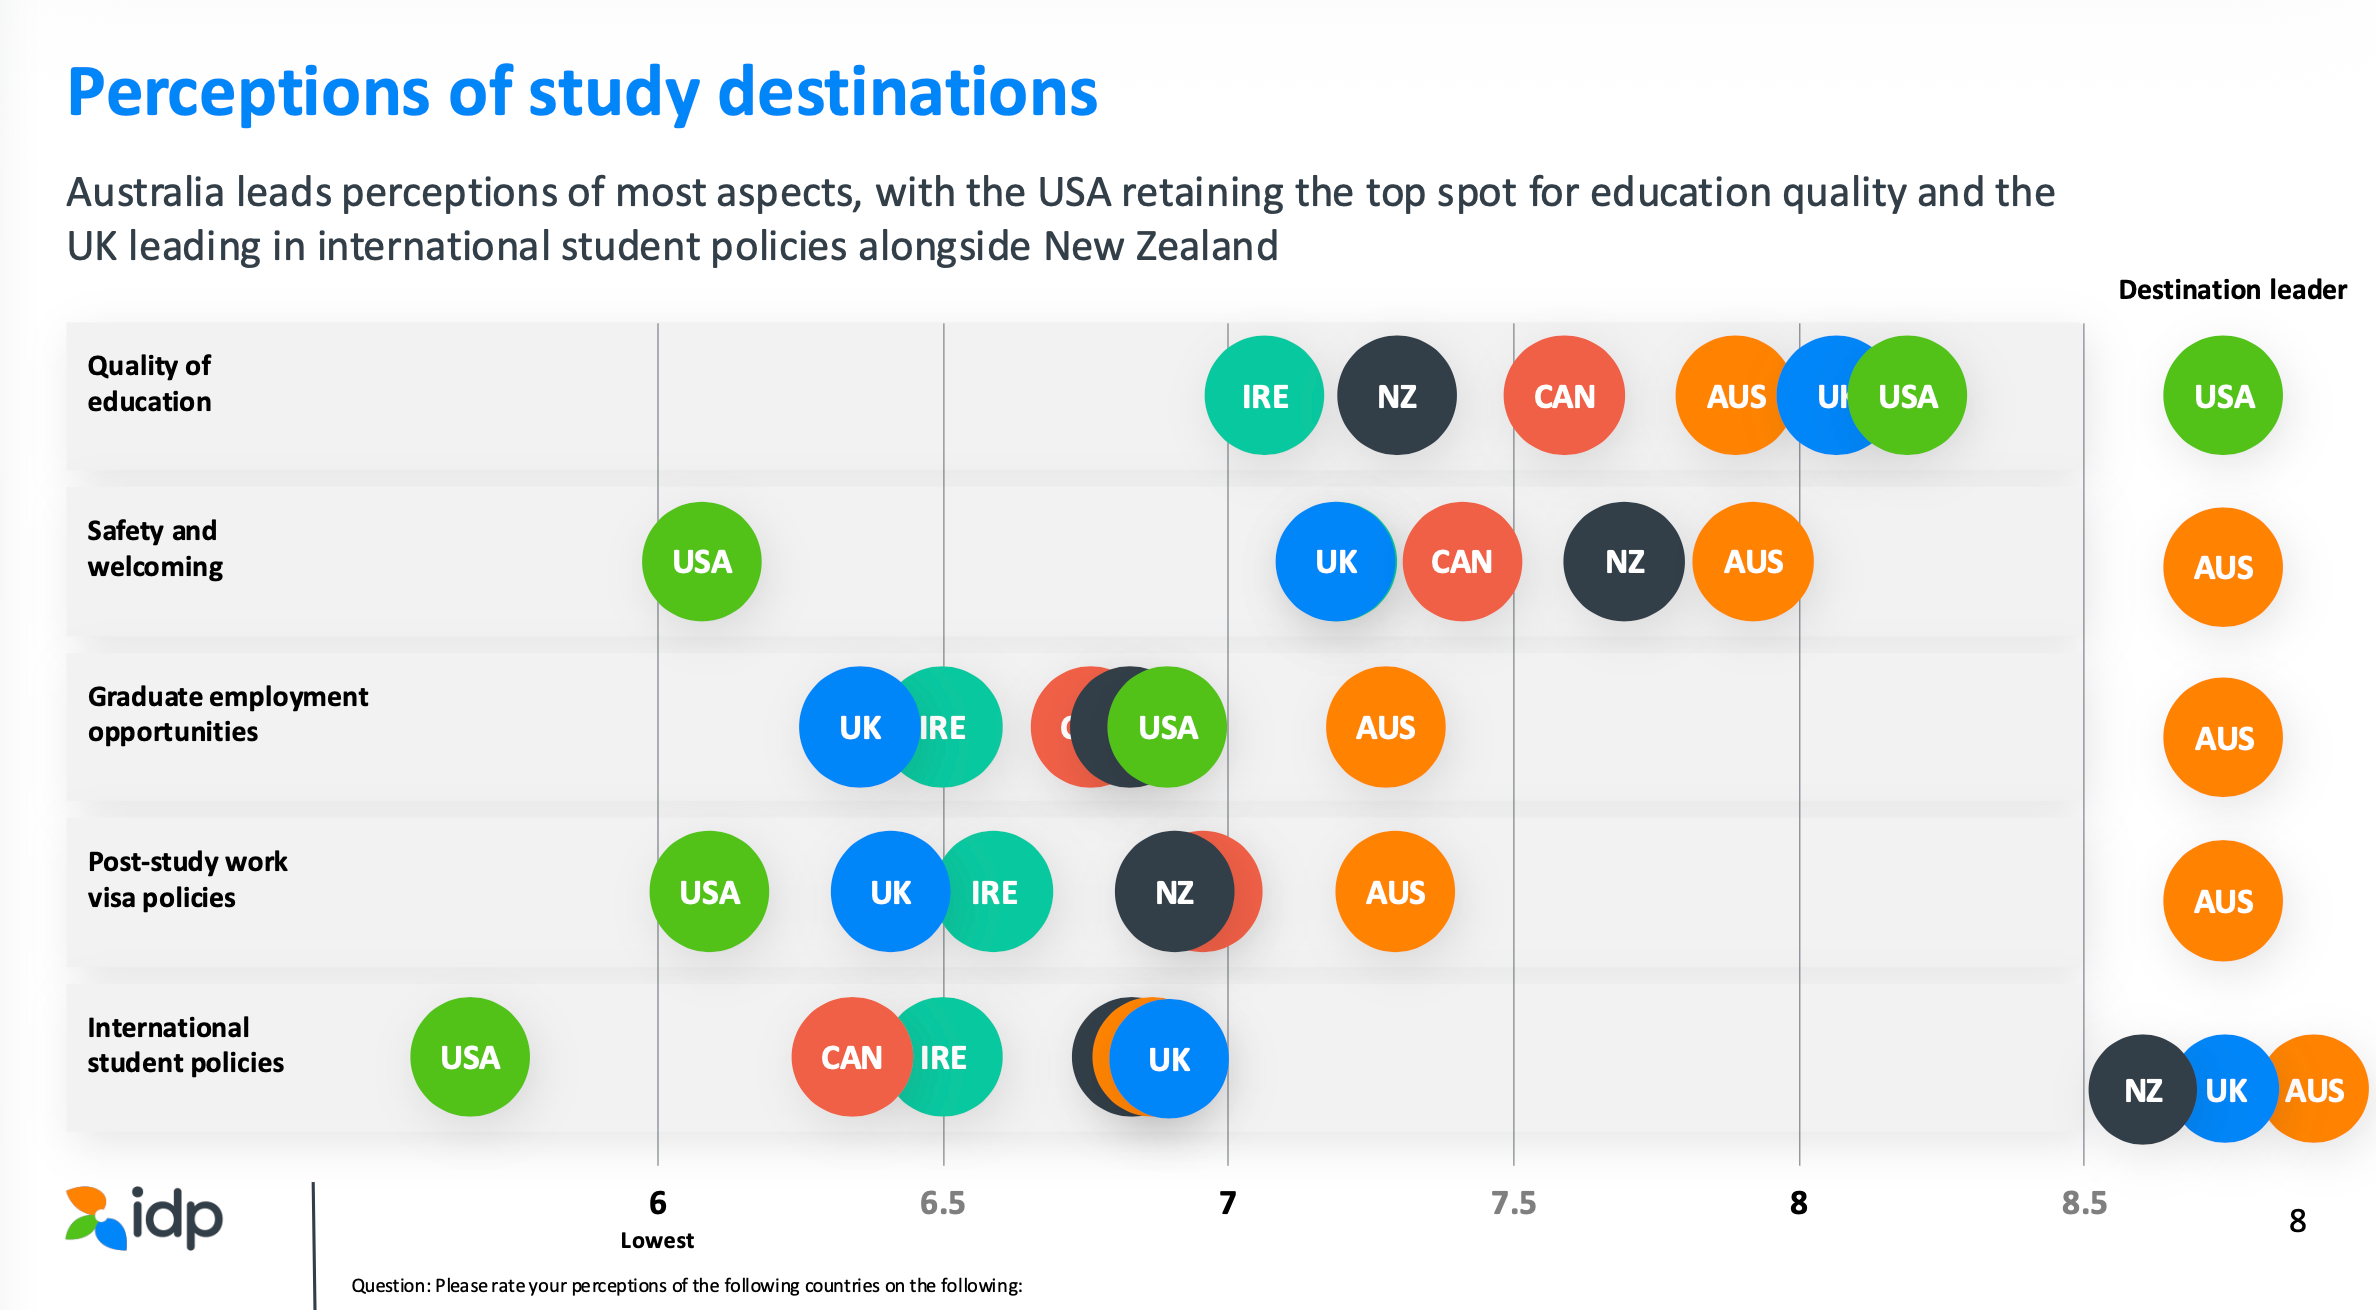
IDP’s Emerging Futures 8 survey of nearly 8,000 students across 134 countries reveals why:
The U.S. ranks lowest among major destinations on safety and welcoming, post-study work visa policies, and clarity of international student policies.
Students aren’t rejecting American educational quality: the U.S. still leads on that measure. But they increasingly perceive the visa system as unpredictable and post-graduation pathways as uncertain. Students recognize U.S. universities are excellent but choose destinations offering more predictable pathways with less risk.
The OECD’s Education at a Glance 2025 report shows how demographic decline and post-growth pressures are shifting international students from “filling seats” to “filling gaps”, reshaping who moves, where, and why.
The Benefits of a K-Shaped Future are Concentrated at the Top Institutions
Institutional stratification intensified dramatically, producing a K-shaped enrollment cycle: the top thrives while the bottom unravels.
The top 25 institutions alone enroll over 321,000 students, more than one-third of total international enrollment.
As Ryan M Allen observed, this is the Age of Conquest: “the biggest and strongest schools only get bigger and stronger.“ The system consolidated into elite hubs with strong STEM programs and OPT pipelines.

The Fall Snapshot confirmed a 17% drop in new enrollments.
Only 29% of institutions reported growth, 14% held steady, and 57% declined, a pattern hitting diverse institution types: from small regional colleges, to elite privates dependent on graduate STEM programs, to selective institutions where master’s enrollment dropped despite stable undergraduate numbers.
The Lost Decade’s False Choice
Too many in the field defend this fragile system, not because it reflects their values, but because they oppose the Trump administration’s immigration policies.
This is a false choice.
Reckoning with the last decade’s realities doesn’t vindicate restrictionist politics or justify the status quo. It creates space for a third path: facing hard truths, abandoning comfortable fictions, and following evidence toward better policy.
Is unprecedented country concentration, lack of diversity of majors and backgrounds, a revenue-driven model, and employment pathways-optimized towards short-term labor markets really the international education we want?
Better policy requires intellectual honesty about what the last decade has actually wrought and admitting real system failures, even when our critics point them out.
What’s The Path Forward?
Here are the critical drivers will determine what comes next:
OPT policy stability, India’s sending capacity, and graduate employment markets determine the core trajectory, while U.S.-China relations, visa processing capacity, institutional funding, competitor destinations, emerging African and Southeast Asian markets, and political perceptions will accelerate, constrain, or redirect where students ultimately enroll.
In my recent conversation with Sonali Majumdar, author of Thriving as an International Scientist, we explore the fundamental contradiction at the heart of the US system for high-skilled immigration: the U.S. recruits the world’s most talented researchers then traps them in a complicated immigration system.
Thriving as an International Scientist

I recently sat down with Sonali Majumdar—RNA biologist, university administrator, and author of a new book, Thriving as an International Scientist (University of California Press).
What Do You Think?
Does the analysis overstate some risks? Miss different ones? Overlook trends that demand closer scrutiny?
The Distributed Progress community has been essential in sharpening these analyses. I’d love to hear your perspectives, especially if you’re seeing patterns on the ground that aren’t showing up in the data yet.
Share your thoughts in the comments below.
Thanks for writing this, it clarifies a lot. So true; the structural cracks are showing evewhere.
The -17 plunge in *new* international students (from IIE's Fall 2025-26 Snapshot Survey) is the data point that is most disconcerting. This aligns with NAFSA's projections, and with CommonApp's reporting of severe declines in international student applications submitted via its platform through the Nov 1, 2025, early application deadline. Not surprised that the lagging Open Doors data (which is measuring the academic year that started under the Biden administration) was relatively positive, but circumstances have shifted dramatically since then. Hope we can resist, recover from, and reverse these trends. https://www.nytimes.com/2025/11/17/us/international-students-enrollment-decrease.html