

SEVIS Beats Expectations–BIG TIME!
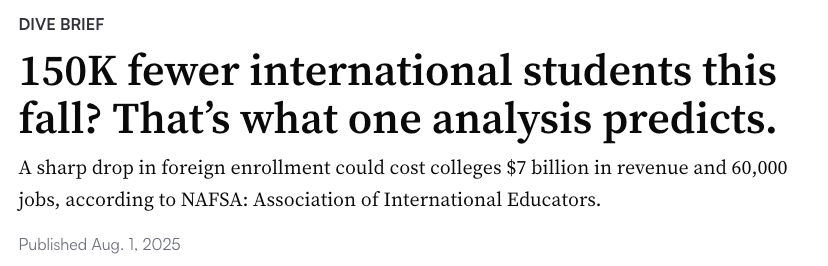
What are we to make of a 15% international enrollment decline that failed to materialize, according to the latest SEVIS data?
Despite the “visa pause” that shuttered consulates for 3 weeks during peak application season, despite 6,000 SEVIS record revocations, despite dramatic NSF and NIH funding cuts that support doctoral students, despite headlines predicting a 15% enrollment decline: international student numbers actually grew this year, according to the latest SEVIS data released by the Department of Homeland Security.
By 0.8%.
Don’t believe me? Download the September 2024 and September 2025 data and run the comparison yourself.
And be ready to see a story no one predicted.
The 1% growth “beat expectations” in a BIG WAY— and the questions this unexpected data point raises will need to be unpacked with smart analysis and good reporting.
I can already anticipate the questions this unexpected result will raise:
Were the “visa pause” and capacity issues more localized than expected?
How much did OPT extensions mask any declines in new enrollments?
Can we trust the SEVIS data?
…and likely others (which I explore at the end of this post)
SEVIS has faced data quality issues before. So, without updated State Department Monthly Nonimmigrant Visa Issuance Statistics (which are only up-to-date as of May at the time of posting this article) and the upcoming IIE Fall Snapshot, we can’t triangulate the SEVIS data.
Note: SEVIS data aggregates enrolled students and OPT and does not disaggregate these data like the IIE Open Doors report.For now, let’s recognize these questions but explore what patterns the latest SEVIS data, taken at face value, might reveal.
1% Growth That Surprised Everyone
Total increase: +9,223 students
2024: 1,222,247 students → 2025: 1,231,470 students
The Wall Street Journal headline would read: “SEVIS Beats Expectations by 16%.” If this were Google’s quarterly earnings, the stock would surge 20% and analysts would upgrade their ratings.
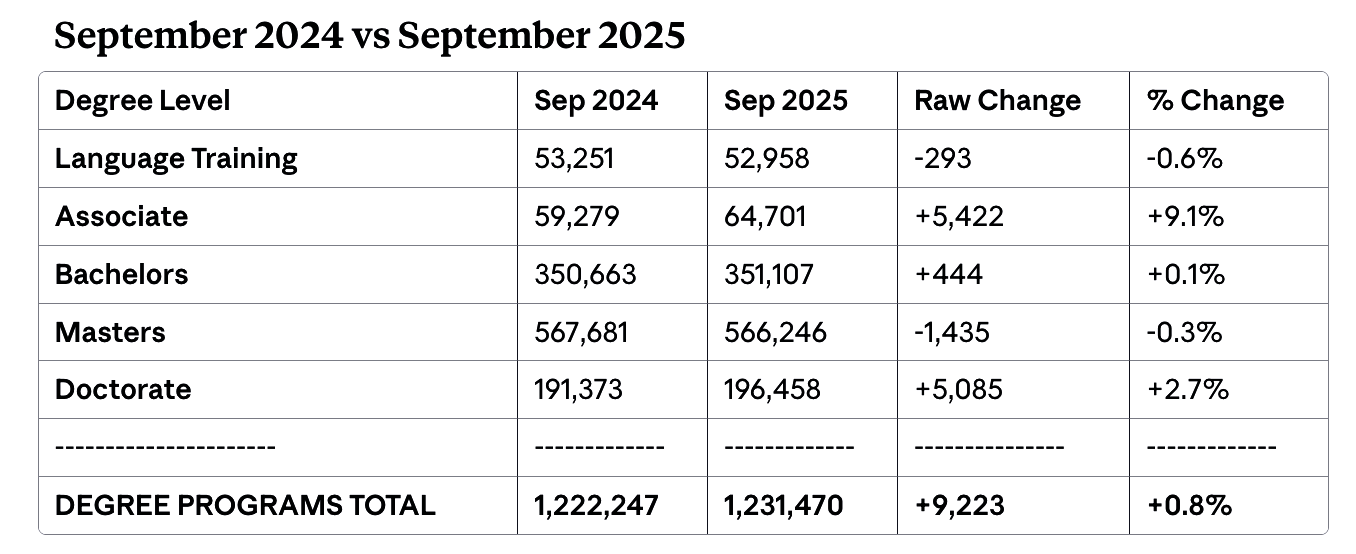
The most startling finding: doctoral enrollment jumped 2.7%, defying expectations that NSF/NIH grant funding cuts would hammer graduate programs.
What might have happened?
While I tracked visa delays and policy turbulence, perhaps I missed a shift: long-term structural shifts were the signals to watch with students making rational economic choices.
The SEVIS data does align with reporting by Abhishek Nair that indicates, while worries about tensions, stability, and safety persist, nearly 91% of international students still intend to study in the US.
And, a recent StudyPortals survey of over 100,000 international students across more than 120 countries continues to find that the US remains the leading study destination for student satisfaction.
The Great 50 State Rebalancing
The United States is unusual. It’s a country but it doesn’t have “one” centralized higher education system—it is really 50 different state systems, and this matters to unpack the latest SEVIS data.
Traditional international student destinations like New York and California experienced modest declines:1
New York (-1.6%, -2,478 students) - Columbia, NYU, Cornell
California (-1.3%, -1,990 students) - UC system, Stanford, Caltech
Kentucky (-7.2%, -1,662 students) - U Kentucky, U Louisville, Western Kentucky
Michigan: (-1.6%, -650 students) - University of Michigan, Michigan State, Central Michigan
Massachusetts (-0.7%, -643 students) - Harvard, MIT, Boston University, Northeastern
While states in the Midwest, Southeast, and Southwest gained students:
Indiana (+8.4%, +2,576 students) - Purdue, IU, Notre Dame
Florida (+3.4%, +2,219 students) - University of Florida, FSU, FIU
Texas (+2.2%, +2,157 students) - UT system, Texas A&M, Rice
Illinois: (+2.4%, +1,583 students) - UIUC, Northwestern, U Chicago
Maryland (+5.9%, +1,443 students) - Johns Hopkins, University of Maryland, UMBC
America’s 50-state structure may transform demographic pressures into geographic opportunities. If New York and California became prohibitively expensive, these students might not have abandoned US degrees—they may have discovered Indiana, Florida, and Texas.
The data suggests international students may be spreading across America, potentially choosing high-quality universities far from expensive, elite coastal cities.
Supply-Side: HALO Absorption Capability
I’ve argued that “supply-side” factors—not demand—drive enrollment patterns. If the SEVIS data are reliable, they offer evidence of my HALO framework: Housing, Affordability, Labor markets, and Openness determine where students land.
Growth states perfected the formula for attraction:
More affordable living + educational value + job opportunities + less political spotlight = student enrollment.
States that declined find themselves in the perfect storm of a looming affordability crisis:
High housing + high tuition + weak job growth + political uncertainty = student seek alternatives.
Housing
Indiana’s median home price ($237,000) sits nearly half the national average ($410,000). California renters pay $2,542 monthly—the nation’s highest. Growth states offer dramatically better housing affordability, while traditional destinations suffer from their own success.
Affordability
Florida’s in-state tuition ($4,540) creates stunning value compared to Massachusetts ($29,259)—a 30.68% premium over the national average.
Labor Markets
Florida and Texas boast growing tech and energy sectors that create what I call “OPT optionality”—practical training opportunities aligned with career trajectories. California, despite tech dominance, ranks 38th for job opportunities. Massachusetts and Michigan post unemployment rates of 4.8% and 5.2%, signaling economic stress.
Openness
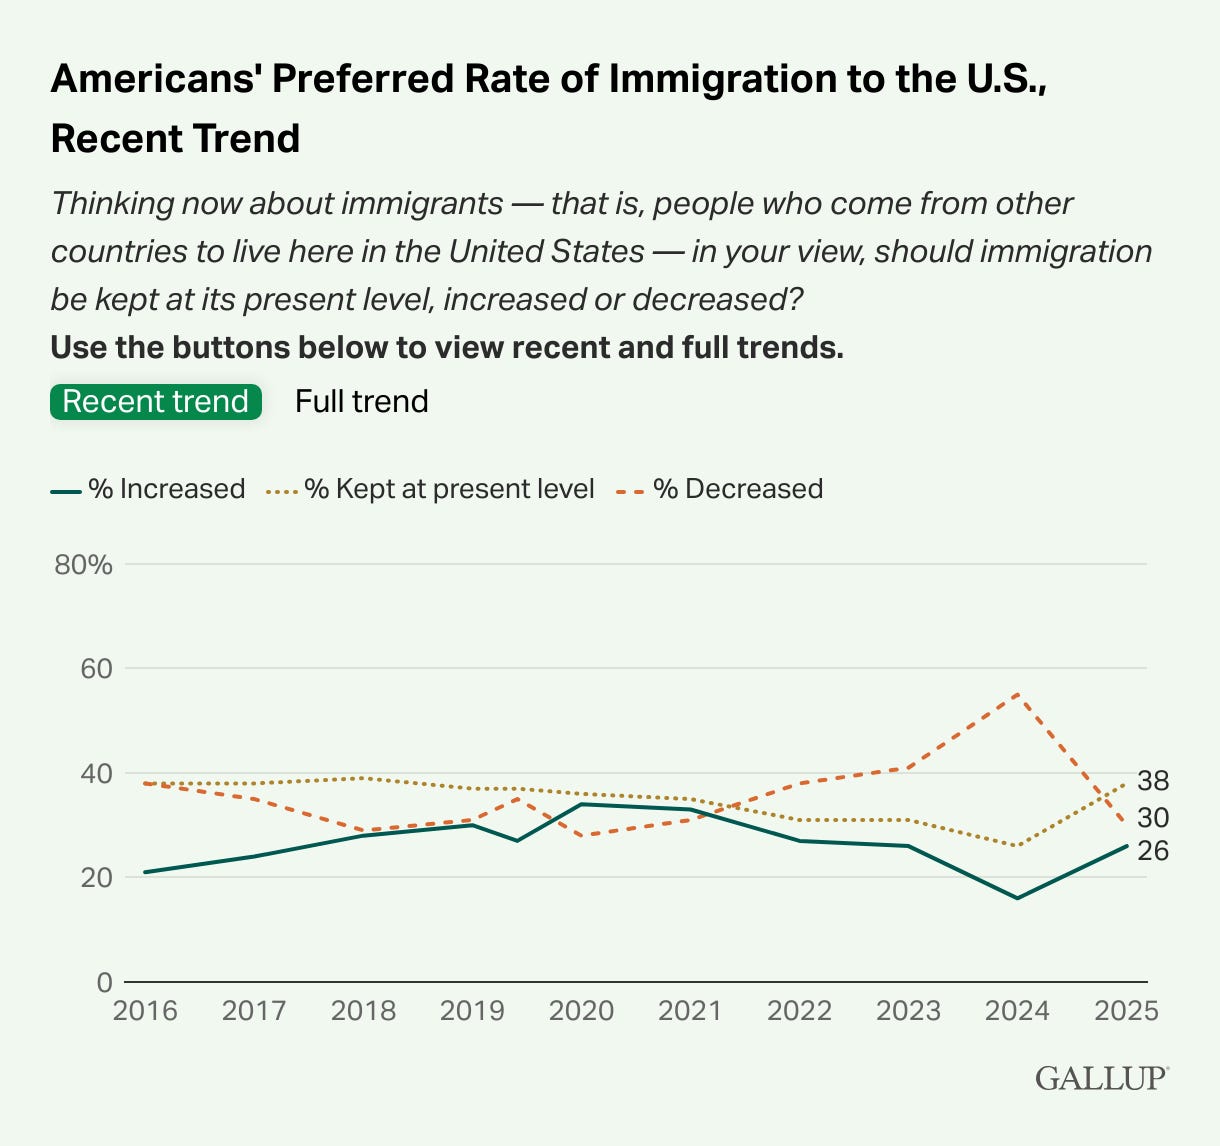
While national immigration sentiment improved in 2025 (79% say immigration is “good”), this varies dramatically by region. Declining states navigate heightened scrutiny of elite institutions and polarized debates about international education. Growing states fly under the media radar, offering safer, more stable environments.
Think of this example:
The student from India who once dreamed of earning a Ph.D. from Harvard calculates that the University of Texas at Austin offers better alternative return on investment. They follow the news about Harvard’s loss of research funding and loss (and subsequent reinstatement) of its ability to enroll internatonal students using SEVIS. They see UT has surged in global rankings while Austin’s tech boom creates internship pipelines that Cambridge cannot match. Texas achieved this through state-level strategy: with Study Texas, partnerships with international companies, and recruitment campaigns positioning Austin as a world-class technology education hub with a great quality of life.
Demand-Side: National Talent Strategies
If supply-side factors are gaining influence, demand patterns suggest potential recalibration and strategic shifts:
Countries with Biggest Declines:
China: -13,982 students (-5.4%)
India: -3,089 students (-0.8%)
South Korea: -2,260 students (-4.8%)
Saudi Arabia: -1,840 students (-13.2%)
Japan: -1,058 students (-6.6%)
Countries with Biggest Increases:
Nepal: +6,364 students (+22.4%)
Vietnam: +3,998 students (+13.6%)
Bangladesh: +2,979 students (+12.3%)
Pakistan: +2,930 students (+21.0%)
Canada: +2,170 students (+6.1%)
Strategic Degree Pathways Emerge
Countries are developing comparative advantages in specific degree programs.
India achieves unprecedented 81% concentration in master’s degrees, aligning with its role as a global services hub. Bangladesh focuses on doctoral programs with 41% concentration—the highest PhD focus among major sending countries, suggesting long-term knowledge infrastructure investment.
Associate degree enrollment grew 9%—a sector that remains largely invisible in broader conversations about global education flows. Countries appear to be rediscovering community colleges as cost-effective entry points into American higher education. Nepal shows a 78% surge in associate degrees (1 in 5 students), highlighting community colleges as strategic pathways. Vietnam reinforces this trend (16% associate degrees) alongside dramatic language training growth (+44%) driven by English learners from Brazil.
These mobility patterns reflect educational pathways aligned with national development goals and talent strategies.
Youth Surge Meets Advanced Economy Demographic Pressures
The OECD Education at a Glance 2025 report highlights demographic forces that are propelling students from emerging economies toward affordable U.S. destinations:
The youth bulge—Nepal (67% under 30), Pakistan (world’s largest youth demographic), Bangladesh (47% under 24), but Pakistan ranks 100th globally in tertiary enrollment access
Economic desperation despite growth—Bangladesh’s middle class tripling by 2025 but 82% informal employment; sustained GDP growth can’t create quality jobs
ROI-focused families—Prioritize budget over prestige; seek existing diaspora communities and streamlined applications
Nigeria would likely join this list too, but visa processing friction likely constrained its growth this past year. As Africa drives global population expansion and China deepens continental investments, the US needs a “pivot to Africa” strategy targeting these and other Middle Power countries with surging youth populations and increasing regional influence.
Declining source countries (China, India) face the opposite pressures: currency weakness makes U.S. education unaffordable, geopolitical tensions, visa and OPT, and H-1B uncertainties, and domestic universities now rival American quality. Most critically, these aging societies—South Korea, Japan, China—are pivoting from sending students abroad to attracting them, competing directly with American institutions for the world’s shrinking pool of college-age youth.
What Signals Did We Miss?
I tracked visa issuances, comparing 2025 to 2024 (down 7-10% before the visa pause). I assumed the standard flow-to-stock model, which would translate visa restrictions directly into enrollment drops.
I estimated 7-10% enrollment declines. This is possible if OPT maintained record levels of growth since 2023/24 enough to mask the decline. There were likely single-digit declines across the sector, with some institutions hit much harder than average. But perhaps the impact across the sector as a whole was not at the scale many of us anticipated.
I was using a standard flow-to-stock mindset. And, perhaps a game-theoretic mindset would have spotted signals I missed:
The Trump administration’s policies created selection pressure favoring adaptive strategies over optimization. The “standard” model fails to recognize students and universities as strategic actors with multiple options:
International students developed mixed strategies—delayed enrollment or pivoted to alternatives—yes, some went to other countries, but perhaps not as many as anecdotes indicate (at least not yet)
Smart SIOs developed flexible strategies: multi-region recruitment, programming pivots, rapid resource reallocation. Some over-admitted students, anticipating visa friction. When consulates cleared backlogs faster than expected, these schools hit enrollment jackpots.
My hunch, based on scattered evidence from enrollment directors I’ve spoken with: the savvy SIOs saw this coming. They diversified their recruitment geographically and over-enrolled students. This wasn’t luck. It was classic option value thinking. The cost of admitting extra students was low compared to the potential upside. Sometimes the best strategy isn’t predicting the future; it’s positioning yourself to benefit when the headlines get it wrong.
Hence, despite a tumultuous year, Columbia welcomed its largest-ever freshman class with 1,806 students, a 20% increase over last year. Meanwhile, mid-tier institutions likely are facing a starker reality. Those lacking Columbia’s flexiblity in admissions—particularly schools with heavy concentrations of students from China, India, Nigeria, South Korea, or Japan—are likely to be among the hardest hit.
For example, just yesterday, Ashley Mowreader reported how International Enrollment [is] Down at Regional Publics, Small Private Colleges.
A Counterfactual Reality Check
Let’s acknowledge the elephant: 0.8% growth beats 15% decline predictions, but represents dramatic deceleration from steady 5-6% historical growth. And single-digit enrollment declines (e.g. -6%) in a sector used to the opposite (e.g. +6%) would represent a double-digit swing (e.g., -12%).
Like companies “beating expectations” on Wall Street while fundamentals weaken, this success masks structural concerns.
1% is better than expected. But it’s not great.
With different policies and a national talent strategy, robust growth could have continued. NSF/NIH cuts may not have fully worked through the system—doctoral enrollment could face downward pressure in the coming years.
It also exposes how little we understood the underlying dynamics.
Not one major forecast got this 1% growth right. Not NAFSA. Not me.
This represents a “polling error” equivalent to 2016’s Trump victory predictions—not flawed methodology, but wrong assumptions about the dynamics shaping the new era of internationalization.
We overweighted policy shock (travel bans, visa restrictions) that dominated the headlines and underweighted system resilience that reflect long-term trends. And perhaps the impact of NSF/NIH cuts might take a while to be fully reflected in the SEVIS data. I’m still having a hard time making sense of the 3% increase in doctoral student enrollment. Any thoughts on this?
Lessons From Last Year (2024-25)
Chris Argyris distinguished single-loop learning (adjusting tactics) from double-loop learning (questioning assumptions). This prediction failure demands double-loop reflection. It is an adaptive challenge.
The field’s conventional stock-and-flow models predicted rational decline—mine included—but these models missed something crucial. They ignored the multi-actor dynamics reshaping today’s internationalization landscape, what I’ve described as the “Global Middle Ages” of internationalization.
While we focused on headline-grabbing disruptions (visa suspensions, travel bans, appointment shortages) last spring and summer, long-term structural trends (demographics, diversification, economic development) and forces may have been quietly steering student, university, and national behavior unnoticed.
Demographics, diversification, and economic development don’t make dramatic copy, but they may drive decisions. These underlying currents could prove more powerful than the policy storms dominating our attention.
Lessons for Next Year (2025-26 and Beyond)
Several lessons emerge as we eagerly await IIE’s Fall Snapshot later this fall:
Reckon with HALO Realities
Students increasingly act as economically rational agents, viewing education as an infrastructure investment, not consumption experience. Students and policymakers are looking for real value from international education and exchange. Universities must align their value propositions accordingly, thinking supply-side, not just demand-side factors that are shaping the future.
Aim for Compositional Diversification
Traditional source country concentration created systemic vulnerability. Universities over-indexed on China/India face concentration risk. Meanwhile, institutions maintaining diversified recruitment portfolios show greater stability. The Shannon diversity index increased meaningfully (2024: H = 3.0955 → 2025: H = 3.1400), indicating more balanced distribution across countries of origin—a compositionally healthier system.
Navigate Policy Uncertainty Strategically
Policy uncertainty isn’t something that happens to universities—it’s an environment demanding proactive engagement. Successful institutions understand they’re playing complex coordination games with multiple stakeholders: students, families, legislators, policymakers, peer institutions. This requires sophisticated strategic thinking, not reactive crisis management.
Successful institutions understand they’re playing complex coordination games with multiple stakeholders: students, families, legislators, policymakers, peer institutions. This requires sophisticated strategic thinking, not reactive crisis management.
Cultivate the Art of New Coalition Building
Real influence with policymakers happens in the “off season,” not amidst media firestorms. Our conversations with policymakers must be candid:
We must acknowledge uncomfortable truths that resonate with legitimate public concerns, actively counter powerful myths that distort the debate, amplify evidence-based arguments that align with national priorities, and retire the comfortable fictions that once worked but now undermine our credibility.
Success requires meeting policymakers where they are, not where they might have been 5, 10, or 20 years ago. The world is different. We need smart policy to match.
Like most people, I was blindsided by the announcement of the $100,000 H-1B fee. This just heightens the need for the slow work of cultivating new coalitions before crisis hits. Build coalitions before you need them:
Industry Champions: Tech CEOs, hospital executives, and defense contractors who speak from direct experience—they know how international graduates launch their most successful startups, generate their breakthrough patents, and anchor their regional talent pipelines.
Bipartisan Economic Voices: Governors, mayors, and economic development leaders whose credibility crosses party lines because they answer to local job numbers, not talking points about “$43 billion” that no longer resonate.
Security Validators: Former military and intelligence professionals who distinguish real threats from phantom ones—advocating for targeted screening over blanket bans because they understand both the risks and the strategic cost of losing talent to competitors.
Questions I’m Asking
Like I mentioned in the introduction, I will be carefully following reporting and analysis on several questions in the weeks ahead:
Will State Department visa statistics, when released, reveal regional patterns behind the “pause” and consulate capacity? What fuller picture emerges as we gather more data points through reporting and other data sources?
How much did OPT extensions mask any declines in new enrollments?
What will the IIE Snapshot reveal when cross-checked against SEVIS numbers?
What evidence do we see of an “Age of Conquest” dynamics in international student enrollment with consolidation at the top-tier institutions alongside pressures faced by regional publics, small private colleges?
How to make sense of reports of international students increasingly considering alternative destinations (even considering leaving the US) with the SEVIS data? It seems like the current mismatch of consumer sentiment and record-high stock prices — why the disconnect?
How real or permanent are the demographic shifts within the US that parallel domestic migration patterns? Is this a similar structural shift in what states international students study?
Does the increase in “new senders” (Nepal, Vietnam, Bangladesh, Pakistan, Canada) signal a shift to a more compositionally diverse international study population in the US with less market concentration away from the two “big senders” (India and China)?
In the meantime, I will be paying far more attention to these structural forces as we move forward.
“Reimagining, Big Bets, Relevance and Hope in Action.”
This requires what NAFSA’s recent strategic retreat captured perfectly: “reimagining, big bets, relevance and hope in action.”

These aren’t just inspiring buzzwords—they represent the strategic mindset that successful institutions used to navigate 2025’s enrollment surprises. The schools that thrived didn’t panic over visa pauses; they reimagined recruitment strategies, made big bets on geographic diversification, stayed relevant to student needs, and turned hope into concrete action.

The evidence—and the public—view international students positively, though some support limitations, according to new Pew Research. And, as Alexander Kustov argues in his new book, In Our Interest: How Democracies Can Make Immigration Popular (Columbia University Press), policymakers presented with clear, local data on international students’ economic contributions prove far more likely to support them.
Internationalization is about the directions we take, not the definitions that will continue to evolve and spark debate.
This moment of cognitive dissonance calls for boldness.
Strategic recalibration, not crisis-driven reactions to every social media firestorm. Double-loop learning. Questioning our assumptions. Confronting our failures. Avoiding romanticizing the past. Wrestling with the complex realities and hard choices leaders must make in the present moment.
It requires deepening our commitment to building a better future for internationalization.
Appendix A: I-94 Visa Arrivals Dashboard
After publication of the article, Brian Meagher of Shorelight shared an excellent resource, a I-94 Visa Arrivals Dashboard in the comments. Adding as an appendix to boost visibility of his work and this important data source.
FYI: It took a minute or two for the Tableau visualization to load for me. If it does for you, be patient — it will load — and it’s worth the wait!

Share Your Thoughts
What are you seeing? Do the on-the-ground realities you're seeing align with the SEVIS data? If not, what is missing?
What questions are you asking that you’d like reporters (or me) to dig into more?
Are you *not* surprised by the SEVIS data indicating growth? You’re a contrarian who has been a bit skeptical of predictions of enrollment declines. If so, what did you see that I (and others) missed? I’d love to hear your perspective.
Note: Institutions are listed for illustrative purposes. The institutions have historically enrolled high numbers of international students. State-level data is based on SEVI,S but their actual institution-level enrollment will not be known until reported in Open Doors.
Hi Chris - thanks for your post. Appreciate everything you do. I would be cautious about using this data to conclude that international student volumes went up. As Clay mentioned, big R1 universities are reporting declines, other universities reporting declines, and when using other data sources we are seeing declines - for example, our team downloaded and analyzed the i94 data of foreigners entering the U.S., and when looking at student visa holders in the month of August, it was down -19% vs previous August.
https://public.tableau.com/app/profile/lusiad/viz/I-94StudentVisasDashboard/Dashboard
Now, this data is counting all entries in the U.S. (including those who visited home for Summer vacation and came back) but how could it be possible that this is so down, yet the SEVIS data shows an increase? It's not adding up.
Ah, Bloomberg is posting through August…